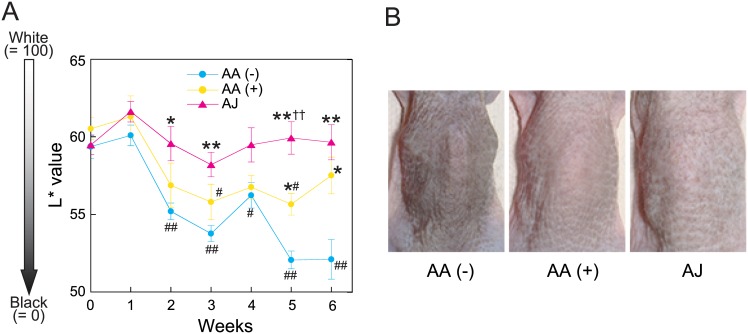
Fig 4. The effects of acerola juice intake on L* value and back skin colors.
(A) The time course of the L* value (a measure of skin lightness). (B) Representative photographs of UVB-irradiated areas at 6 weeks. The values are expressed as the means ± the SEMs of five animals. ANOVA analysis: F6, 28 = 17.4, P < 0.0001 for the AA (-) group, F6, 28 = 4.4, P < 0.01 for the AA (+) group, and F6, 28 = 1.1, P = 0.39 for the AJ group. Sharps indicate significant differences (#P < 0.05, ##P < 0.01) compared with the start date by Dunnett's test for post hoc comparisons. ANOVA analysis: F2, 12 = 4.1, P < 0.05 at 2 weeks, F2, 12 = 6.7, P < 0.01 at 3 weeks, F2, 12 = 3.8, P = 0.053 at 4 weeks, F2, 12 = 24.2, P < 0.0001 at 5 weeks, and F2, 12 = 10.5, P < 0.01 at 6 weeks. The asterisks indicate significant differences (*P < 0.05, **P < 0.01) compared with the AA (-) group by Tukey’s HSD post hoc comparisons. The double daggers indicate significant differences (††P < 0.01) compared with the AA (+) group by Tukey’s HSD post hoc comparisons. AA, ascorbic acid; AJ, acerola juice.

