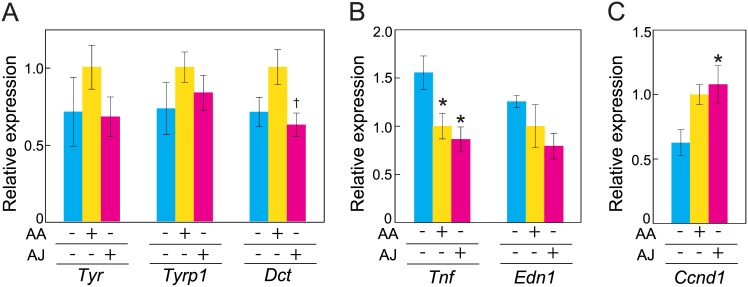
Fig 5. The effect of acerola juice intake on gene expression in the skin.
(A) Melanogenesis-related enzyme genes Tyr, Tyrp1 and Dct. (B) Cytokine genes Tnf-a and Edn1. (C) Cell cycle progression gene Ccnd1. Quantifications of the mRNA are illustrated relative to the Rplp1 mRNA. The mRNA levels of the AA (+) group were designated as 1.0. The values are expressed as the means ± the SEMs of five animals. ANOVA analysis: F2, 12 = 1.1, P = 0.369 for the Tyr gene, F2, 12 = 1.1, P = 0.372 for the Tyrp1 gene, F2, 12 = 4.1, P < 0.05 for the Dct gene, F2, 12 = 6.3, P < 0.05 for the Tnf-a gene, F2, 12 = 2.3, P = 0.147 for the Edn1 gene, and F2, 12 = 4.7, P < 0.05 for the Ccnd1 gene. The asterisks indicate significant differences (*P < 0.05) compared with the AA (-) group by ANOVA followed by Tukey HSD post hoc comparisons. The daggers indicate significant differences (†P < 0.05) compared with the AA (+) group by ANOVA followed by Tukey’s HSD post hoc comparisons. AA, ascorbic acid; AJ, acerola juice.

