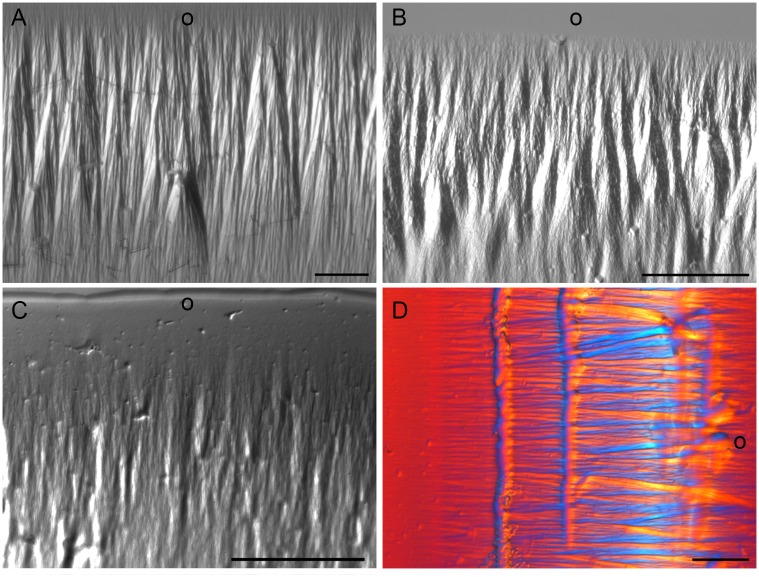
Fig 3. Optical anisotropy of DNA samples extracted from HeLa cells for FT-IR analysis as observed using polarization microscopy.
Birefringence images of DNA from untreated control (A) and 1 mM VPA- (B) and 20 mM VPA-treated cells (C). An example of images obtained using a differential interference contrast (DIC) system is also shown for DNA from 1 mM VPA-treated cells (D). Blue and yellow interference colors against a red background (D) resulted from the orientation of the DNA fibers in relation to the gamma axis of Berek’s U-CBE compensator inserted into the microscope. This procedure was used to validate that the negative sign of the birefringence, typical of double-stranded B-DNA, was achieved. The outer edge of the DNA drops dried on slides is indicated (o). The bars equal 50 μm.

