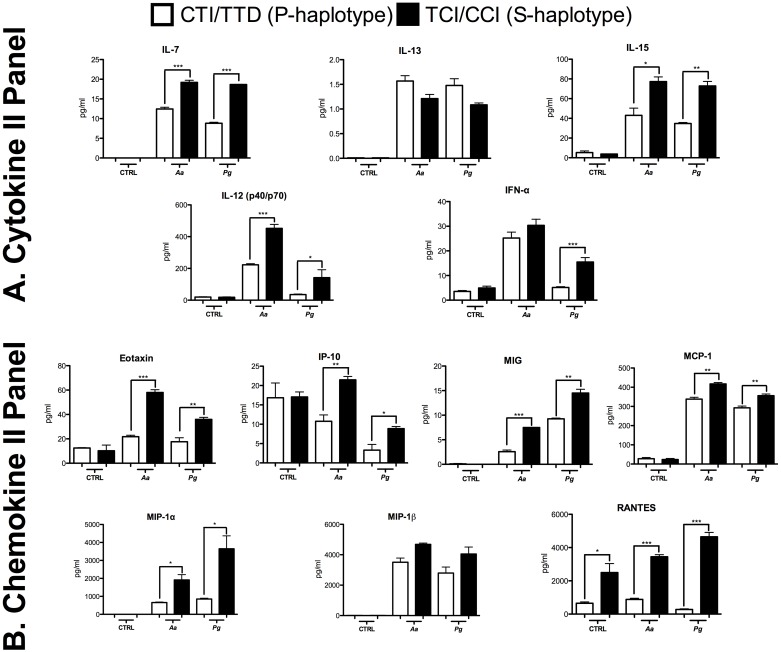
Fig 3.
A. Cytokine II Panel, B. Chemokine II Panel represented by the proteins analyzed by a multiplex assay in the whole blood of subjects carrying susceptibility or protection haplotypes after Aa and Pg stimulation. The concentration is expressed in pg/mL. *p < 0.05; ** p < 0.01; *** p < 0.001. The Mann-Whitney test.

