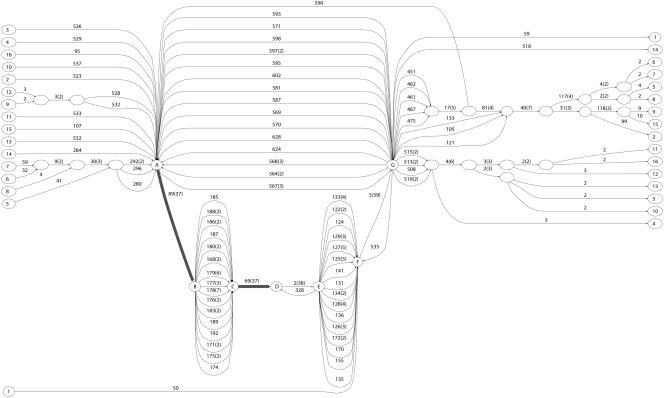
Figure 11.
Comparison of blocks produced by TBA and ABA. A region on human genome surrounding the CAV2 gene is displayed on the “zoo genome” (NISC target region T1) of the UCSC genome browser (Kent et al. 2002). We use BLASTZ with parameters “B = 1 C = 2” to include reverse strand matches. Blocks of multiplicity greater than one are shown with shades of gray indicating the multiplicity of the blocks. Most of the blocks have multiplicity of three, corresponding to three-way alignments. Darker gray blocks indicate higher multiplicity and include duplications and inversions (matches on the reverse strands).

