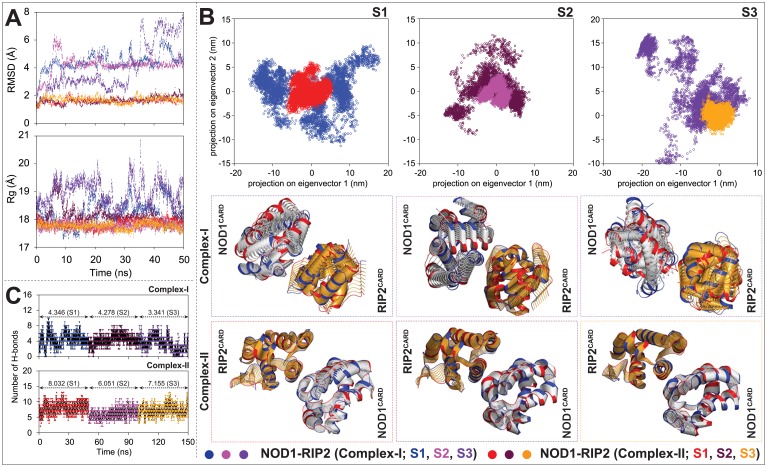
Fig 2. Analysis of complex stability of heterodimers and total numbers of intermolecular H-bonds formed during the course of simulation.
(A) Graphs represent the backbone RMSD and Rg of NOD1-RIP2 CARD-CARD heterodimeric complexes (analysed from three individual trajectories (S1, S2, and S3)). (B) Principal component analysis of the said complexes. The projection graphs of first two eigenvectors (x-axis represents the PC1 and y-axis symbolizes PC2) of individual CARD-CARD complexes (type-I mode) indicate the global motion of complexes in phase space (upper panel). In lower panel, the superimposition of structural coordinates associated with the principal component 1 (PC1) of NOD1-RIP2 complexes display the global motion. The initial conformations were colour in blue, the final in red and the intermediate ones were displayed in silver (NOD1CARD) and orange (RIP2CARD). (C) The graphs indicate total number of H-bonds that formed by individual CARD-CARD complexes (type-I mode) during 50ns MD simulation in all three individual production runs.

