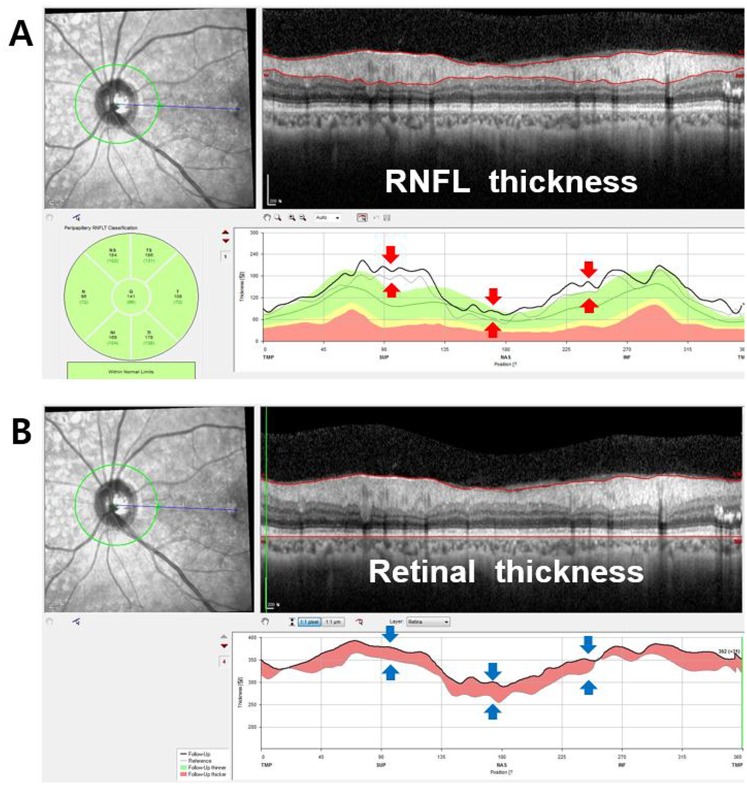
Fig 3. The similar profiles of RNFL thickness and retinal thickness change in the peripapillary area.
A) The red arrows indicate the increase of peripapillary RNFL thickness during the 6-month follow up period (gray line at baseline and thick black line at 6 months). B) The blue arrows indicate the increase of peripapillary retinal thickness during the follow up period (gray line at baseline and thick black line at 6 months).

