
Fig 1. VAEM reveals a heterogeneous distribution of BRI1-GFP and SERK3-mCherry in the PM.
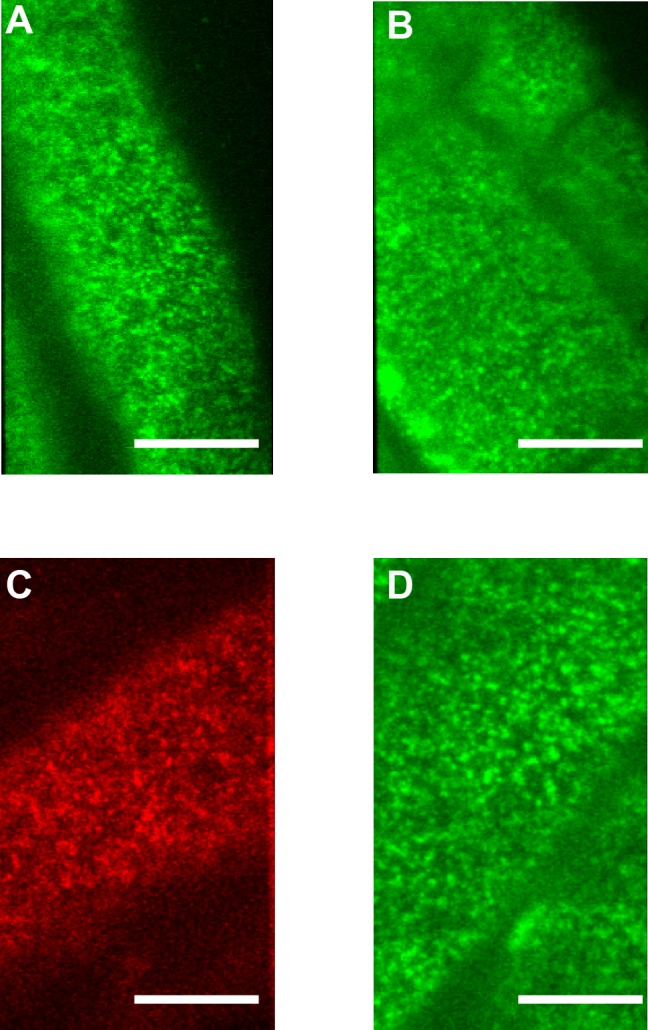
Typical VAEM images of live root epidermal cells of 6 day old A. thaliana seedlings showing PM distribution of (A) BRI-GFP line1, (B) BRI1-GFP line 2 and (C) SERK3-mCherry, (D) BRI1-GFP in a serk1serk3 mutant plant. Images taken are of epidermal cells in the early elongation zone. Scale bars represent 10 μm.