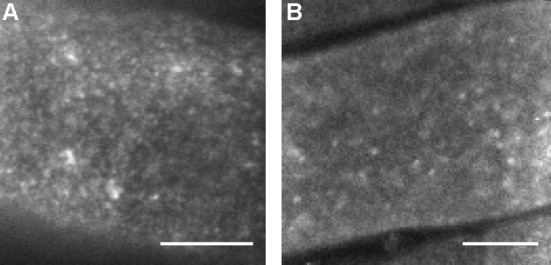
Fig 3. BRI1-GFP nanoclusters imaged using VAEM and SSO-confocal imaging.

BRI1-GFP line 2 expressed in root epidermal cells imaged using VAEM (A) or SSO-confocal imaging (B). Both imaging modalities show similar nanocluster distributions. Scale bars represent 10 μm.
