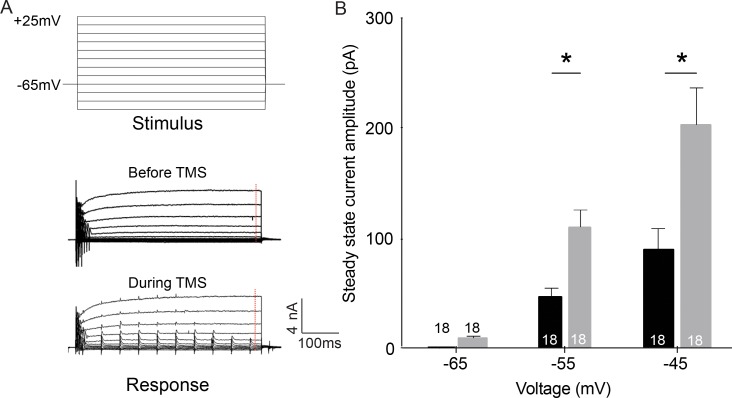
Fig 4. rTMS increases steady state current in cortical neurons.
(A) Example voltage clamp traces of (top) stimulus and (bottom) responses (before and during TMS) in cortical neurons (traces have been filtered to remove the TMS artifact). The red dotted line in the response traces denotes the point at which steady state current was measured. (B) Population data of steady state current of cortical neurons at different voltages (Numbers in the bars indicate sample size). Error bars represent SEM.

