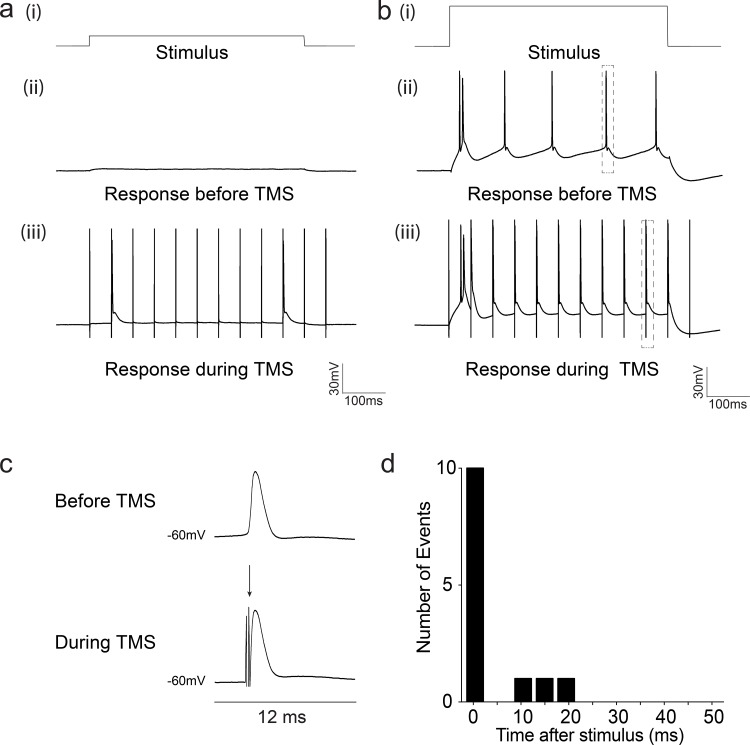
Fig 5. rTMS induces action potentials and reshapes spike timing.
(A) Example trace of a neuron showing lower activation threshold during rTMS stimulation (i) 50 pA subthreshold stimulus step (ii) response before rTMS, (iii) response during rTMS (B) Example trace of a neuron showing the effect of rTMS on spike timing (i) 300 pA supratheshold stimulus step (ii) response before rTMS, (iii) response during rTMS. (C) Upper panel: Magnified view of an action potential before TMS (corresponding to grey box in B (ii)), Lower panel: Magnified view of a TMS artifact (arrow head, two pronged artifact) followed by an action potential during stimulation (corresponding to grey box in B (iii)), (D) Representative post stimulus time histogram (PSTH) of the response neuron in (B) during rTMS stimulation.

