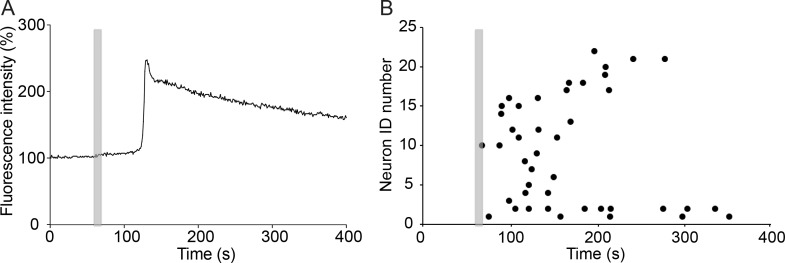
Fig 6. rTMS increases intracellular calcium concentrations in cultured neurons.
(A) Example time course plot of the increase in calcium signal in a cultured cortical neuron due to TMS. Grey bar indicates 10 s TMS stimulation. (B) Plot showing peaks of intracellular calcium fluxes (black dots) in individual neurons (n = 23) as they occur after TMS stimulation (grey bar).

