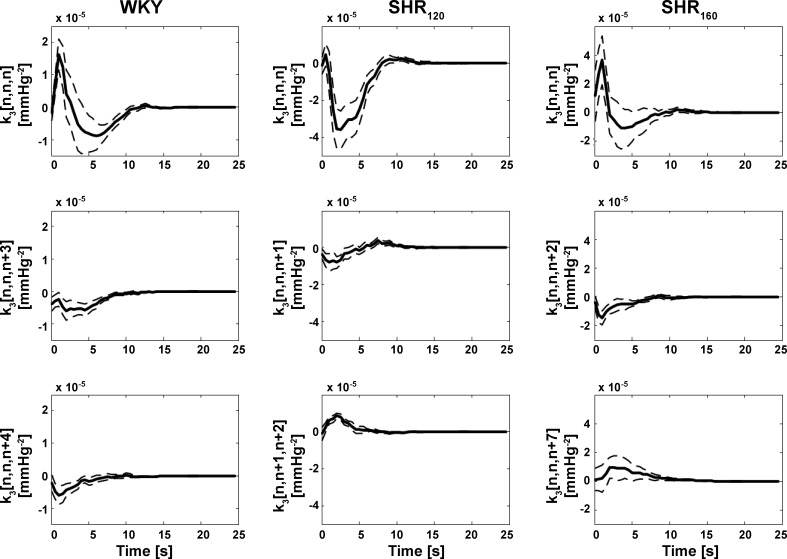
Fig. 2.
Group average two-dimensional (2D) slices of the estimated (four-dimensional) third-order kernels (k3[n1,n2,n3]) in Eq. 2 with the largest (top), second largest (middle), and third largest (bottom) energies. The group averages are illustrated as the mean over the subjects (solid line) and mean ± SE over the subjects (dashed line), whereas energy is defined as the sum of squares of the samples of the kernel slice. The diagonal slice (k3[n,n,n]) was largest in energy for Wistar-Kyoto (WKY rats during Gaussian white noise CSP stimulation with mean of 120 mmHg), spontaneously hypertensive rats (SHR120 during the same CSP stimulation), and SHR160 (during the Gaussian white noise CSP stimulation but with mean of 160 mmHg).

