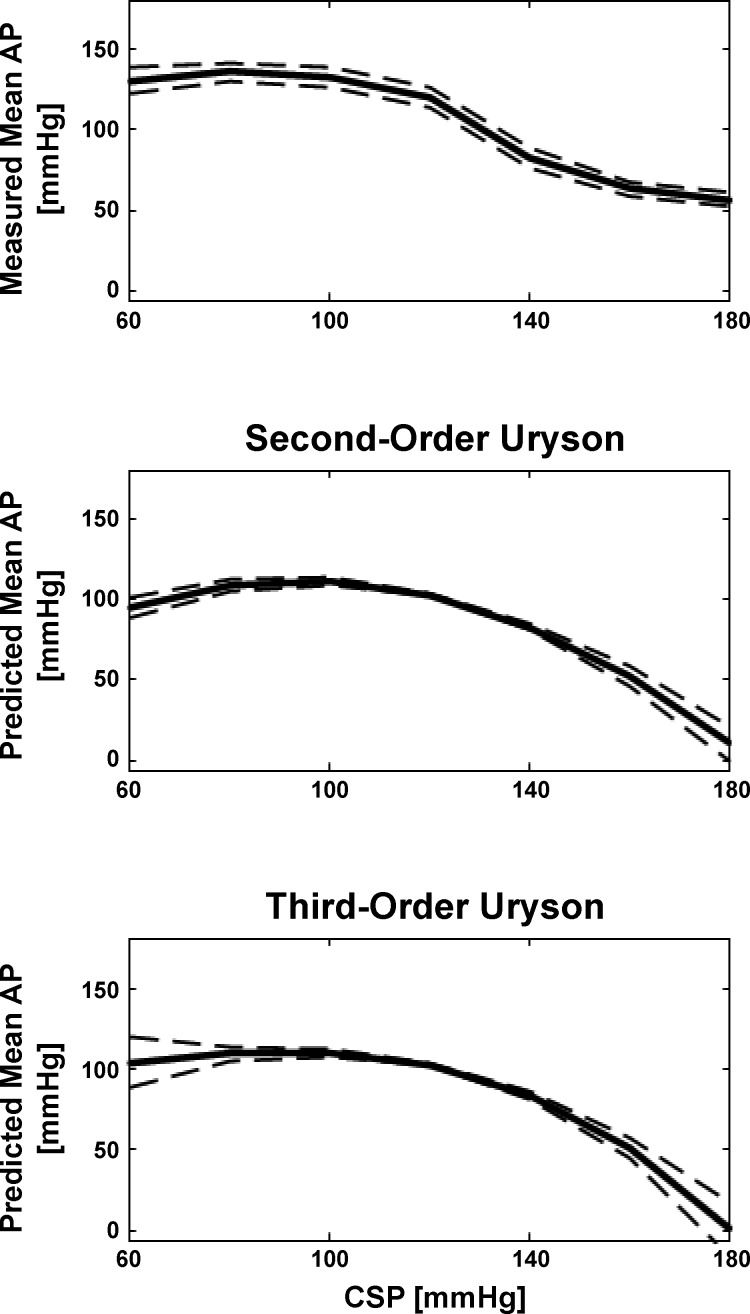
Fig. 5.
Group average static nonlinearity curves measured and predicted by the second- and third-order Uryson models of the total arc (identified via the frequency-domain method for Gaussian inputs) in response to a staircase CSP input for WKY. The two models similarly predicted thresholding (maximal AP response) but not saturation (minimal AP response).

