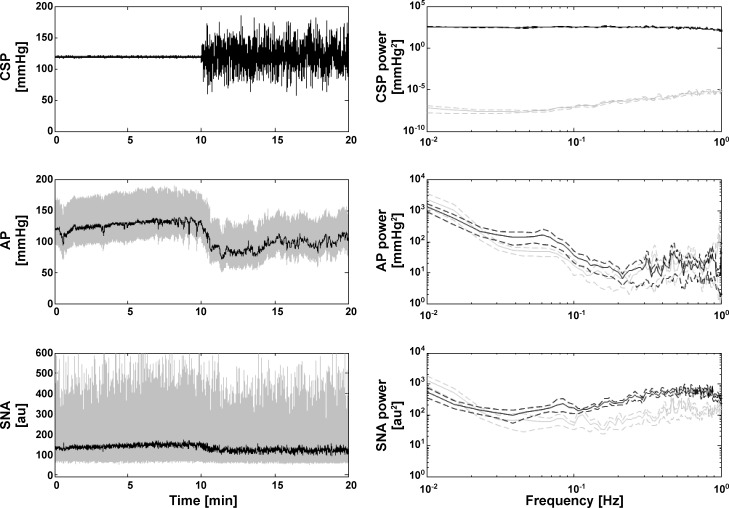
Fig. 7.
Representative time series for AP and sympathetic nerve activity [SNA; measured from splanchnic nerve and then normalized as described elsewhere (17)] in response to fixed and Gaussian white noise CSP stimulations for one WKY (left). au, arbitrary units. Group average power spectra for CSP, AP, and SNA (right). Gray and black lines indicate the fixed and Gaussian white noise CSP inputs, respectively. These preliminary results indicate that SNA from higher brain centers contribute to the unexplained AP variance of the nonlinear total arc models (see Table 1), particularly in the low frequency regime.

