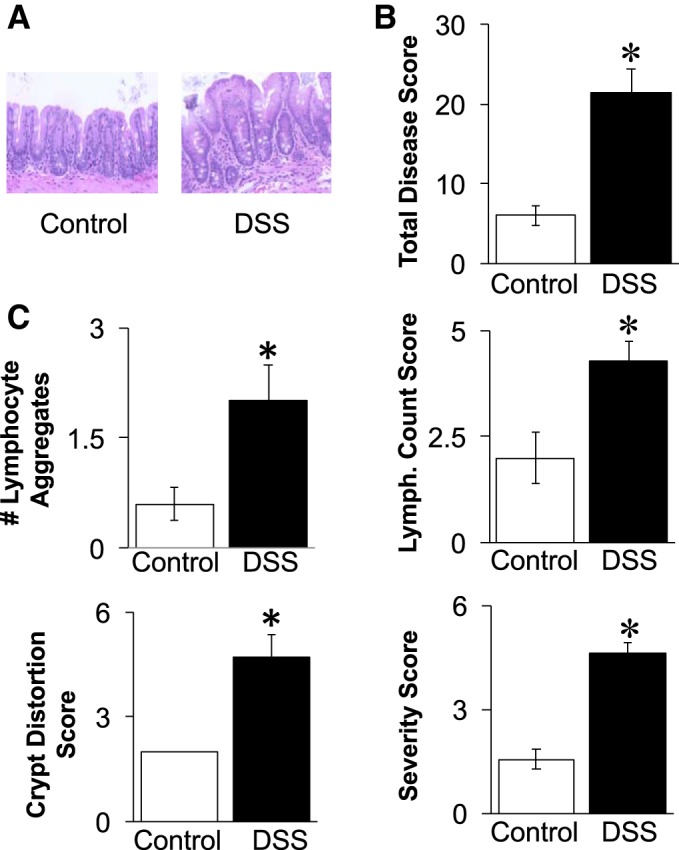
Fig. 2.

Assessment of colitis by a broad-range scoring system. A: representative cecum sections from control and DSS treated mice. B: total disease score, which is the sum of all live mouse health scores and histological scores. C: individual histological scores. Values represent averages ± SE. Statistical analyses used the Mann-Whitney U-two-tailed t-test. *P ≤ 0.01, n ≥ 9 per group.
