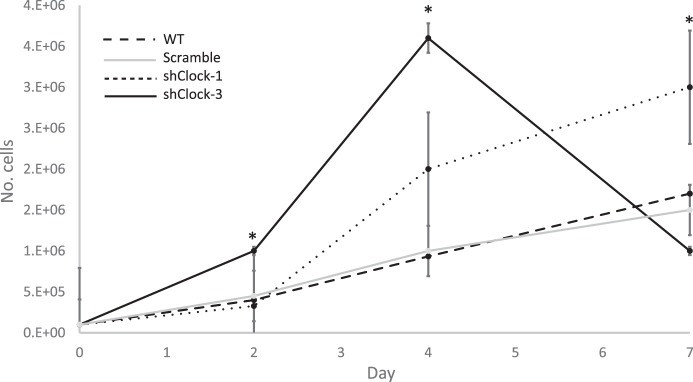
Fig. 3.
Growth curve analysis of the impact of shRNA sequence on HC11 cells in culture. On day 0, 100,000 cells were plated in 35-mm dishes, and the number of cells were counted on days 2, 4, and 7 after plating. Two-way ANOVA of data from three experiments showed that day and line (WT: dashed line; shClock-1, dotted line; shClock-3, solid black line; scramble, solid gray line) had a significant effect (P < 0.05) on growth. The Tukey post hoc test indicated that cell numbers were different from control at P < 0.05 (*).

