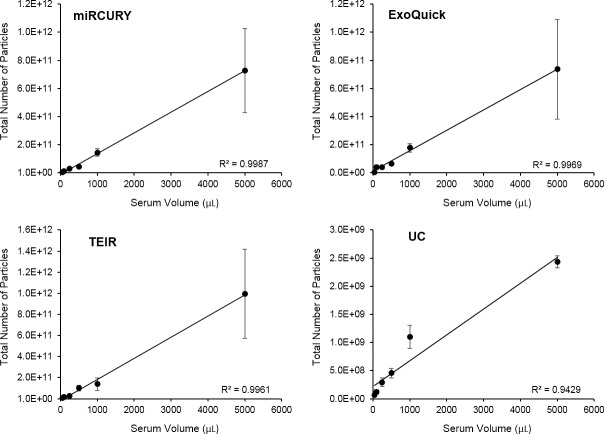
Fig 3. Correlation between the volume of serum and the total number of particles isolated.
The relationship between the volume of serum and the total number of particles was linear for all four isolation techniques: (A) miRCURY, (B) ExoQuick, (C) TEIR, and (D) UC. The data in this graph represent the average number of isolated particles ± SEM (n = 3).

