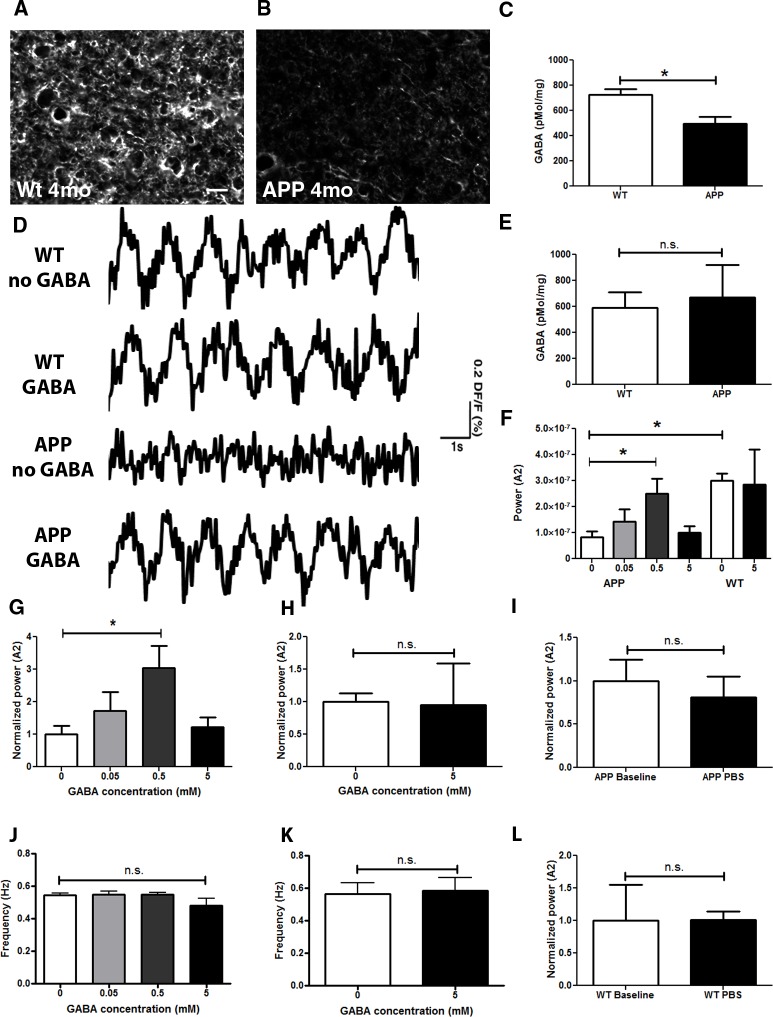
Fig 2. Decrease in GABA in APP mice.
GABA immunoreactivity in the cortex of a 4 month old wildtype littermate control (A), and a 4 month old APP mouse (B). An example in B shows an extreme case. (C) Bar graph comparing cortical GABA levels measured with HPLC in mice older than 4 months (n = 5–6 mice/group). (D) Slow oscillation traces before and after topical application of 0.5 mM GABA to somatosensory cortices of WT and APP mouse brains. (E) Cortical GABA levels measured with HPLC in 2 month old WT and APP mice. (F) Bar graph showing a dose response to a topical application of 0 (PBS+/+), 0.05, 0.5 and 5mM GABA to the brains of APP mice; 0 and 5mM GABA to brains of WT mice (n = 3–4 mice/group). (G) Bar graph showing a dose response to a topical application of 0 (PBS+/+), 0.05, 0.5 and 5mM GABA to the brains of APP mice, normalized to the power after PBS+/+ application (n = 3–4 mice/group). (H) Slow oscillation power (normalized to 0 mM GABA or PBS+/+) before (0 mM GABA or PBS+/+) and after 5mM GABA application to wildtype mice (n = 3 mice/group). (I) Slow oscillation power (normalized to baseline) before (baseline) and after PBS application to APP mice (n = 7 mice/group). (J) Mean slow oscillation frequency in response to various GABA applications to APP mice (n = 3–4 mice/group). (K). Mean slow oscillation frequency before (0mM GABA or PBS+/+) and after 5mM GABA application to wildtype mice (n = 3 mice). (L) Slow oscillation power (normalized to baseline) before (baseline) and after PBS application to wildtype mice (n = 3 mice/group). Scale bar, 50 μm. * p<0.05.

