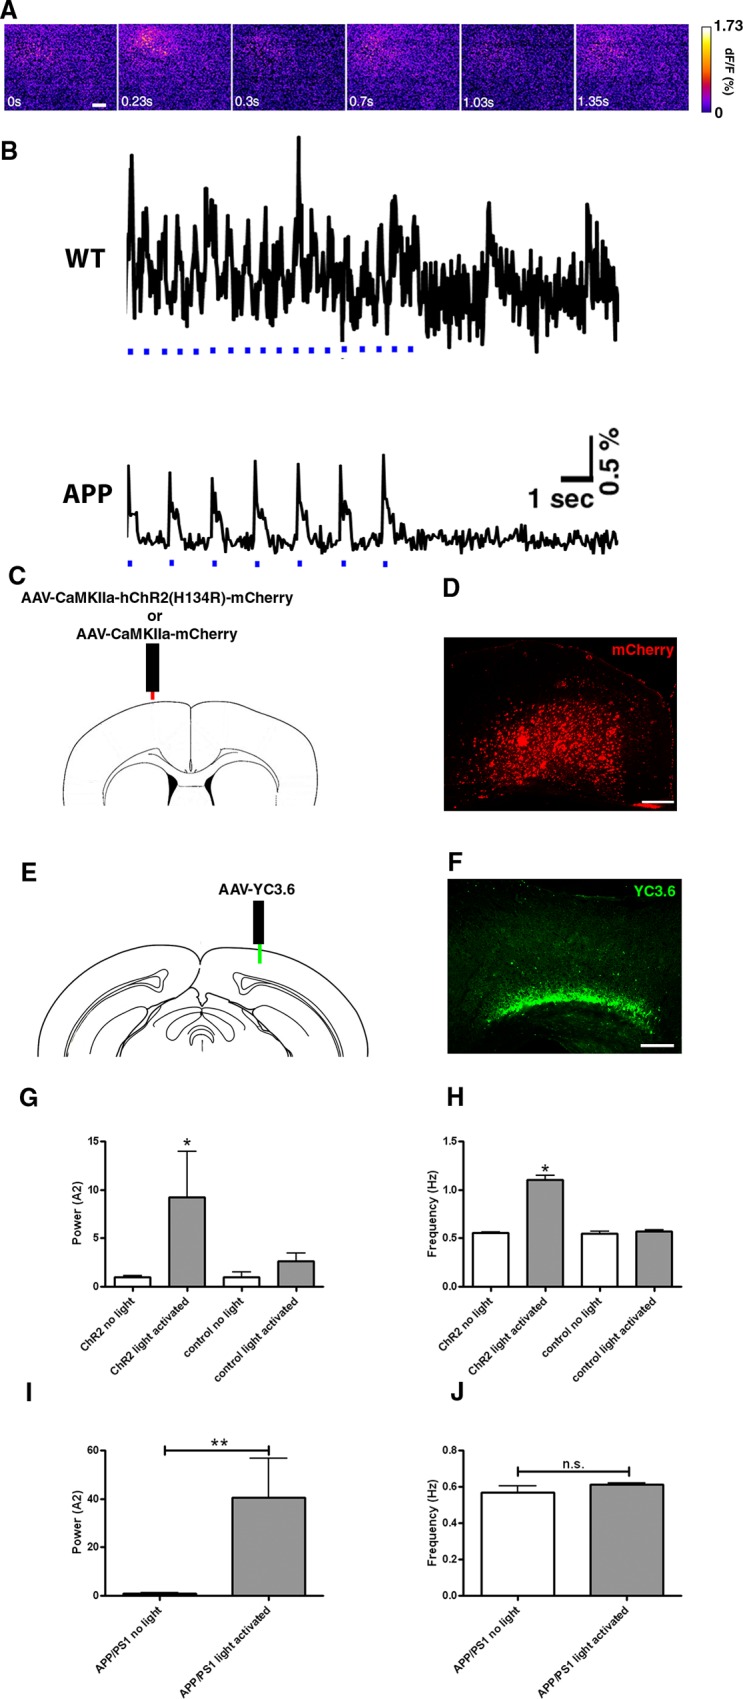
Fig 5. Optogenetic manipulation of slow oscillations.

(A) Voltage-sensitive dye signal showing spatiotemporal resolution of neural circuit oscillations driven with light activation of ChR2 at 1.2 Hz in the somatosensory cortex of a Thy1-ChR2-YFP mouse. The images correspond to the first three oscillations in B. Scale bar, 20 μm. (B) WT: Trace of voltage-sensitive dye signal showing that slow oscillations can be driven at twice the normal rate with light activation of ChR2 at 1.2 Hz when light pulses are present (light pulses are depicted in blue) in the somatosensory cortex. The frequency of waves slows after cessation of light stimulation. APP: VSD trace depicting restoration of slow oscillations in APP mice expressing ChR2 virus under CamKIIα promoter when stimulated with light at 0.6 Hz. A decrease in power is evident after light stimulation is stopped. (C) Site of ChR2 viral injection under the CamKIIα promoter tagged with mCherry, or empty vector. (D) mCherry expression in the cortex in a coronal section of postmortem brain tissue. Scale bar, 100 μm. (E) Site of viral injection of YC3.6 in the contralateral hemisphere posterior to the site of ChR2 expression. (F) YFP expression in the cortex in a coronal section of postmortem brain tissue. Scale bar, 100 μm. (G-H) Neuronal activity driven with light activation of ChR2 in wildtype mice (n = 3–5 mice). Control corresponds to mCherry vector lacking ChR2. Light activation of ChR2 at 1.2 Hz increases the power and frequency of slow oscillations. Powers (G) and frequencies (H) of neuronal activity generated in the presence or absence of light with or without ChR2. (I) Slow oscillation power (normalized to APP without light activation) and (J) mean slow oscillation frequency before or after light activation of ChR2 in 4 month old APP mice expressing the virus (n = 6 mice). * p<0.05, ** p≤0.01.
