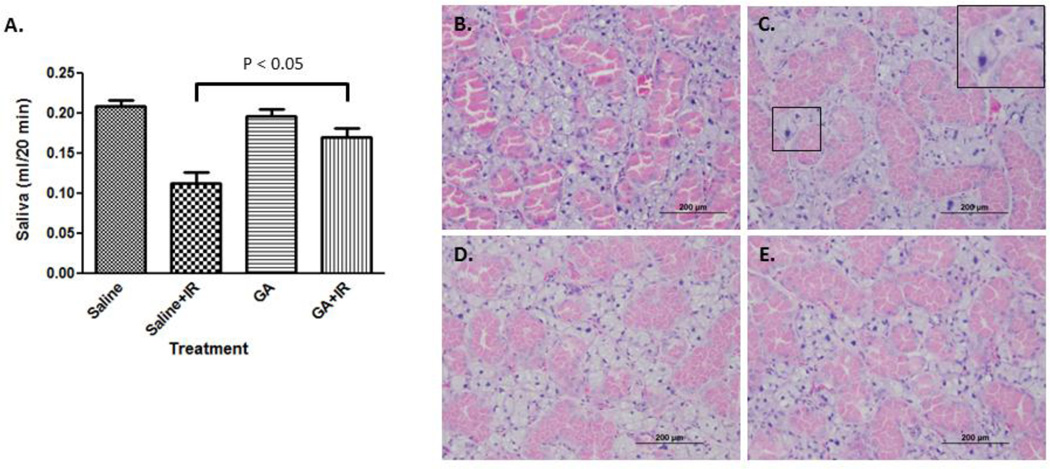
Figure 6. Salivary glands post irradiation.
A. The head and neck region of the animal was exposed to 2 Gy × 5 days. Animals were injected with saline or GA (50 mg/kg) each day after radiation. Stimulated saliva was collected at 5 weeks after the onset of radiation. Data shown is mean ± SEM. B–E. Histopathologic images of salivary glands; non-irradiated (B), irradiated (C), gallic acid-treated (D), irradiated and treated with gallic acid (E). Inset: enlargement of select area showing nucleo- and cytomegaly.

