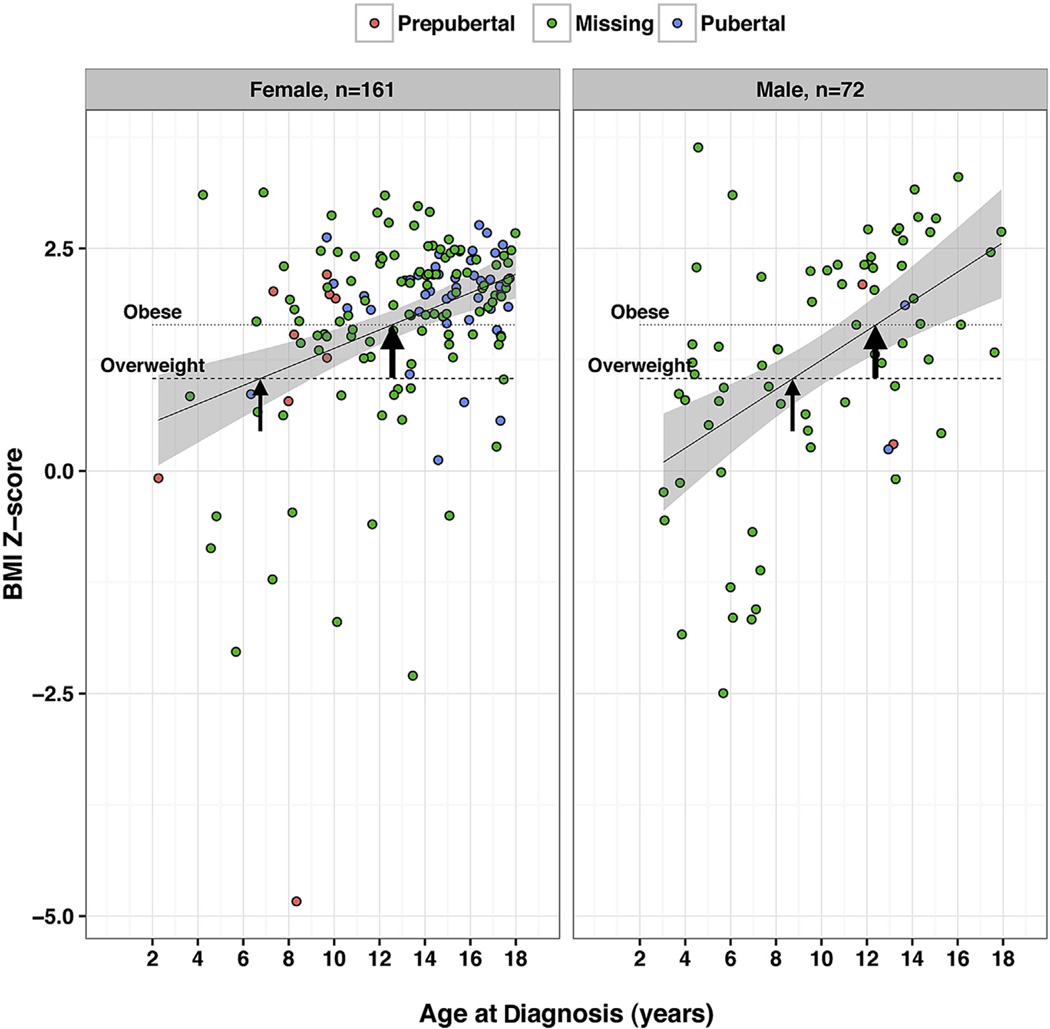
Figure 1.
Dot distribution plots showing the relationship between body mass index (BMI) Z-score and age at diagnosis of pediatric idiopathic intracranial hypertension (IIH). In both girls and boys, there is a positive relationship between BMI Z-score and age at diagnosis of definite pediatric IIH. Specifically, in boys, a moderate association was noted (Pearson’s correlation coefficient, 0.50; 95% confidence interval [CI], 0.30–0.66; P < 0.001; n = 72), and in girls, a weak association was noted (Pearson’s correlation coefficient, 0.34; 95% CI, 0.20–0.47; P < 0.001; n = 161). In both groups, the circles represent data obtained from individual participants, whereas the color of the circle represents pubertal status (“missing” indicates that pubertal information was not available). The line represents the results of a linear regression of BMI-Z with 95% CIs of the mean (Stata software; Stata Corp, College Station, TX). Horizontal reference lines indicate the Centers for Disease Control and Prevention (CDC)-defined BMI Z-scores for overweight and obesity features in the pediatric population. The thin arrows indicate overweight thresholds and thick arrows indicate obese thresholds. The overweight threshold indicates the intersection between the plotted linear regression relationship and the BMI Z-score of 1.04 (CDC definition of overweight). The obese threshold indicates the intersection between the linear regression relationship and the BMI Z-score of 1.64 (CDC definition of obese). The overweight threshold occurred at 6.7 years in girls and 8.7 years in boys. The obese threshold occurred at 12.5 years in girls and 12.4 years in boys.

