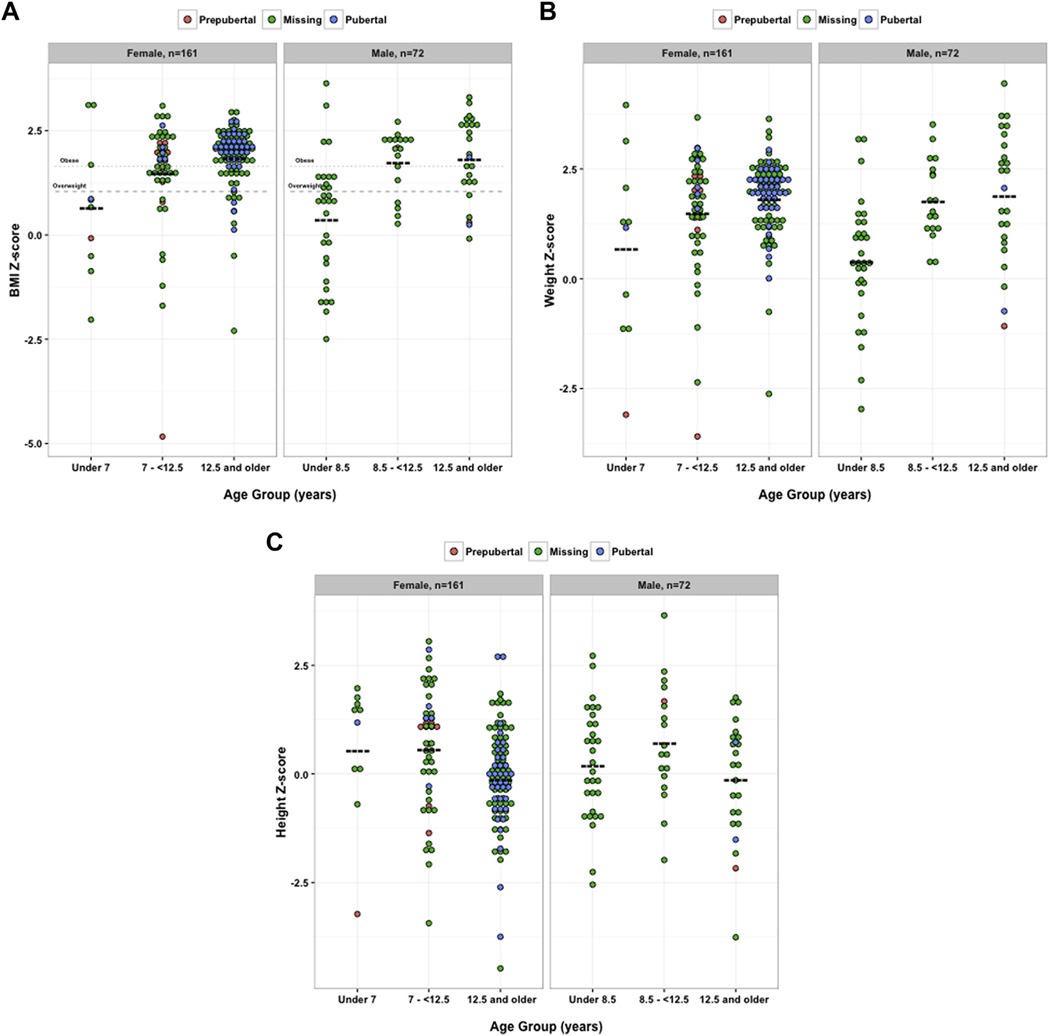
Figure 2.
Dot distribution plots showing the distinct differences in anthropometric features seen between defined age categories in participants with pediatric idiopathic intracranial hypertension (IIH). Distribution plots illustrate body mass index (BMI), weight, or height Z-scores, seen in defined age categories of participants with pediatric IIH. The age cutoffs were defined empirically, using the regression analysis in Figure 1. For girls, the categories were young children younger than 7 years, early adolescents between 7 and 12.5 years of age, and older adolescents 12.5 years of age or older. For boys, the categories were young children younger than 8.5 years, early adolescents between 8.5 and 12.5 years of age, and older adolescents 12.5 years of age or older. In both boys and girls with pediatric IIH, (A) BMI Z-scores and (B) weight Z-scores increased in older age categories (P = 0.0001 in girls and P < 0.0001 in boys, analysis of variance of BMI Z-scores; and P = 0.0015 in girls and P < 0.0001 in boys, analysis of variance of weight Z-scores). C, In girls and boys with pediatric IIH, only height Z-scores measured in the early adolescent categories were higher than the age- and gender-matched hypothesized values. Statistical comparisons used 1-way t test analyses to compare mean Z-scores against a hypothesized mean Z-score of 0.00 (e.g., age- and gender-matched normative data). In girls, P = 0.28 in those younger than 7 years, P = 0.004 in those 7 to 12.5 years, and P = 0.45 in those 12.5 years of age or older. In boys, P = 0.35 in those younger than 8.5 years, P = 0.03 in those 8.5 to 12.5 years, and P = 0.71 in those 12.5 years of age or older. In (A), (B), and (C), circles represent individual data points, whereas the color of the circle indicates pubertal status (“missing” indicates that pubertal information was not available). Boldface, dashed lines indicate mean values.

