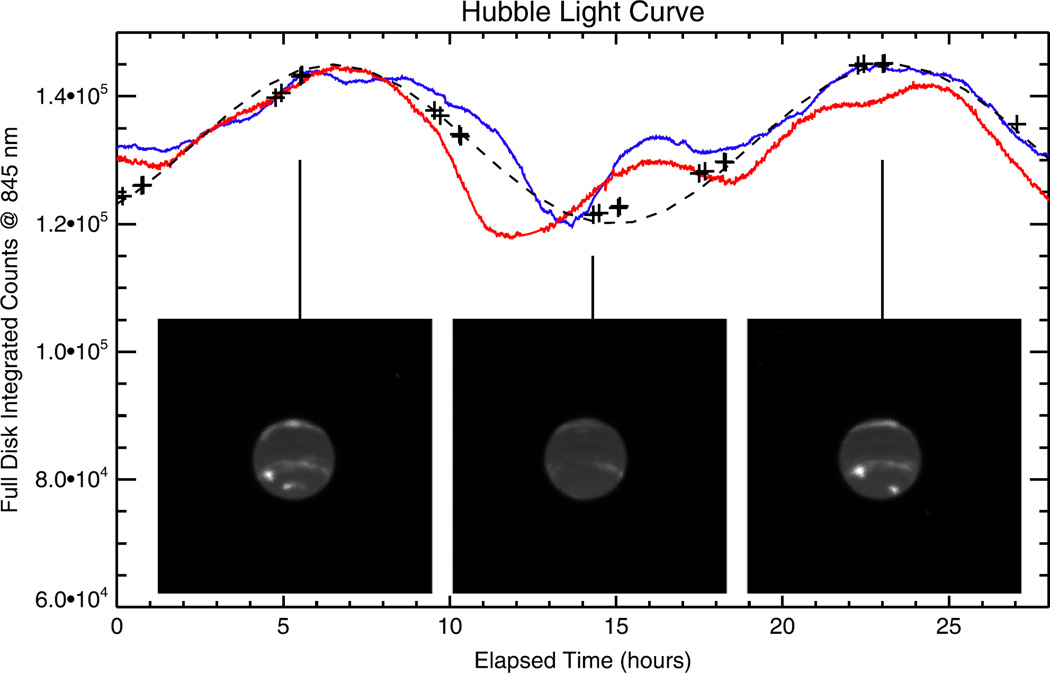
Figure 6.
Light curve of Neptune from Hubble full-disk brightness at 845 nm (plus signs). A sinusoidal variation, with a 16.8 hr period and arbitrary amplitude, is shown by the dashed line. For comparison, normalized Kepler light curves beginning at Day 6 and Day 25 are shown in blue and red, respectively. (An animation of this figure is available.)

