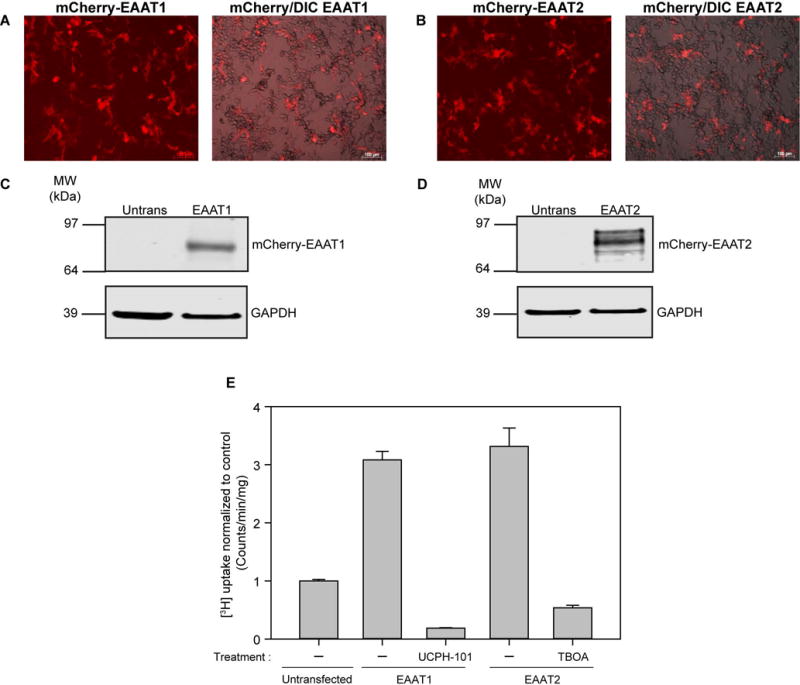
Figure 1.

Heterologous expression of human glutamate transporters EAAT1 and EAAT2 in HEK293T cells. A, A representative image of mCherry EAAT1 transfected HEK293T cells viewed using the red channel (excit. 595 nm/emis. 620 nm) (left). A representative mCherry/DIC merged image is shown on the right. B, A representative image of mCherry EAAT2 transfected HEK293T cells viewed using the red channel (left). A representative mCherry/DIC merged image is shown on the right. The scale bar corresponds to 100 μM in all panels. C, Western blot showing EAAT1 and GAPDH expression in untransfected and EAAT1-transfected HEK293T cells. D, Western blot showing EAAT2 and GAPDH expression in untransfected and EAAT2-transfected HEK293T cells. E, Average [3H]-glutamate uptake in EAAT1 and EAAT2 transfected cells (n=3, ± S.D) normalized to untransfected HEK293T cells. Inhibitors UCPH-101 (10 μM) and TBOA (10 μM) were applied to EAAT1 and EAAT2-transfected cells respectively for 20 minutes prior to a 20 minute [3H]-glutamate uptake measurement protocol.
