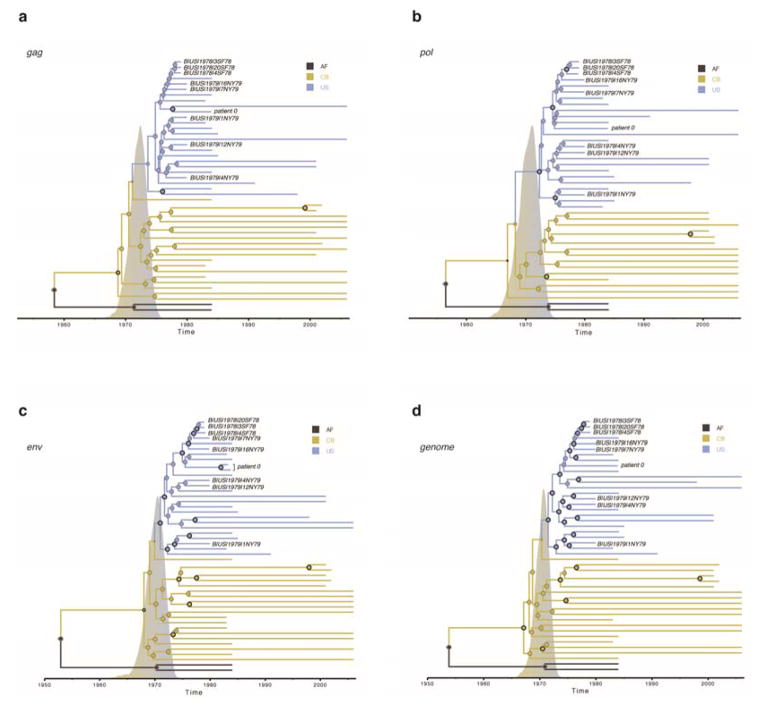
Extended Data Figure 3. Maximum clade credibility (MCC) tree summaries of Bayesian spatio-temporal reconstructions based on different genome region data sets.
MCC trees for the same strains are shown for a) gag, b) pol, c) env and d) the complete genome. The tips of the trees correspond to the year of sampling while the branch (and node) colours reflect location: the sampling location for the tip branches and the inferred location for the internal branches (AF, Africa; CB, Caribbean; US, the United States). Tip labels are provided for the newly obtained archival HIV-1 genomes. The diameters of the internal node circles reflect posterior location probability values. Thick outer circles represent internal nodes with posterior probability support > 0.95. We also depict the posterior probability densities for the time of the introduction event from the Caribbean into the U.S on the time scale of the trees.

