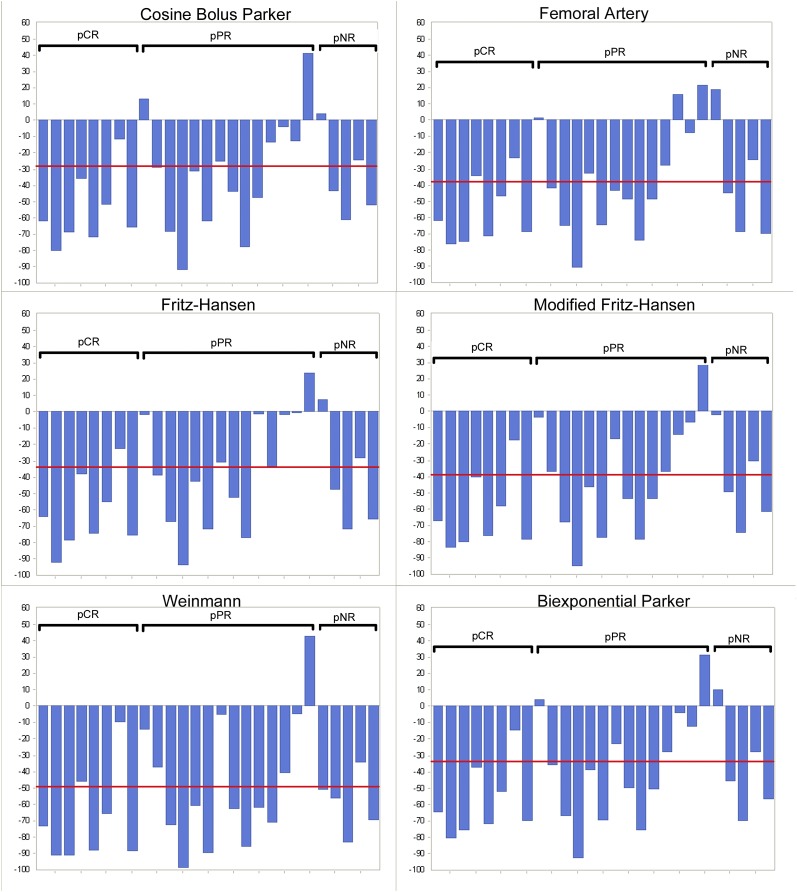
Figure 4.
Histogram showing change in the transfer constant by arterial input function (AIF) for each patient before and after neoadjuvant chemotherapy. Patients are grouped into those with pathological complete response (pCR), those with pathological partial response (pPR) and those with pathological non-response (pNR): repeatability r (as a % of the mean) lines are displayed for each AIF (from the reproducibility cohort shown in Table 4).

