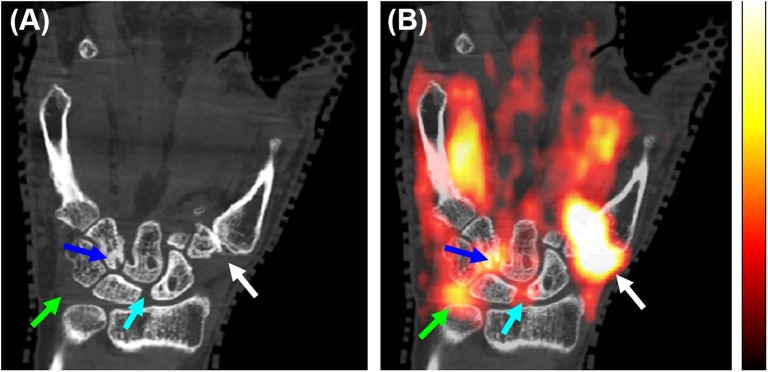
Figure 2.
Extremity positron emission tomography (PET)/CT of a patient with rheumatoid arthritis; the coronal section showing a volar view of the right wrist from the (a) CT and (b) PET/CT overlay. Arrows show sites of bone erosion and corresponding fluorine-18 fludeoxyglucose (18F-FDG) uptake (blue and light blue arrows) [maximum standardized uptake value (SUVmax) = 2.2], 18F-FDG uptake in the pisiform–triquetral compartment (green arrows) (SUVmax = 1.89) and 18F-FDG uptake at the first carpometacarpal joint (white arrows) (SUVmax = 5.50). The linear range of the PET colour scale shown is 18–45% of the SUVmax. For colour image see online.

