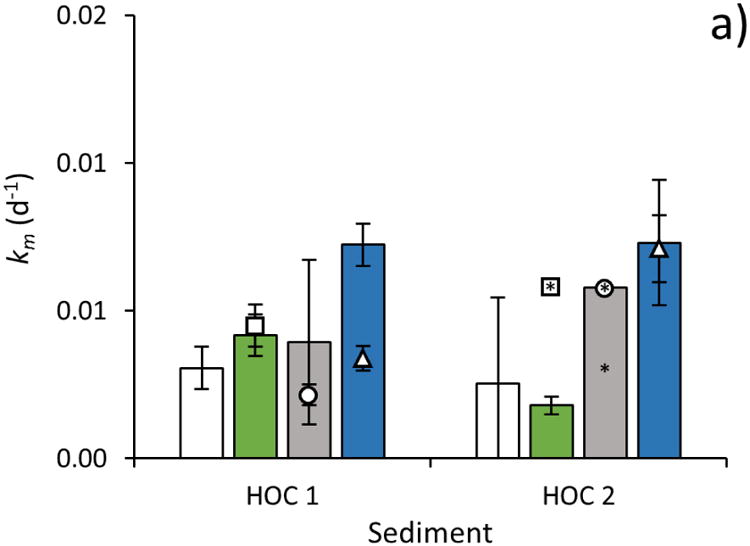
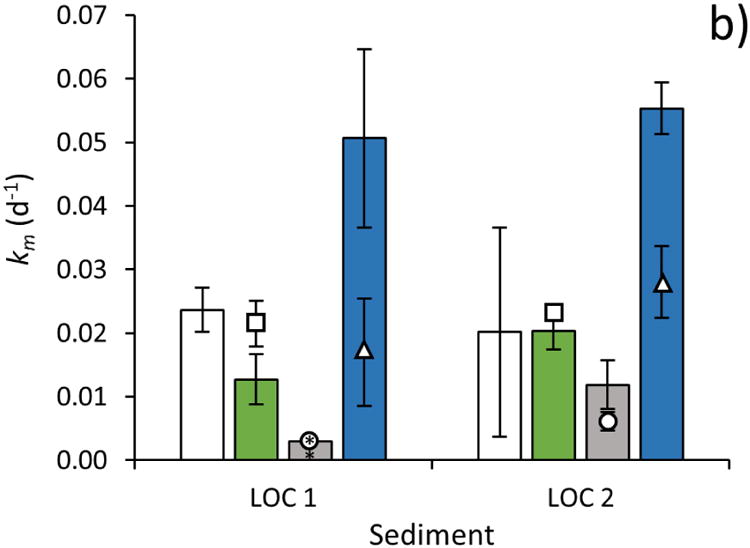
Fig 2. Methylation rate constant determined using different HgII tracers in sediments with a) high organic carbon content (HOC 1 and HOC 2) and b) low organic carbon content (LOC 1 and LOC 2).


The methylation rate constant (km, d-1; ±SD, n=3) was determined by adding HgII to sediment slurries as an inorganic aqueous tracer (HgII(aq), white bars), as HgII bound to particulate organic matter (HgII-POM, green bars), as β-HgS(s) nanoparticles (β-HgS(s)nano, gray bars), and as HgII bound to dissolved organic matter (HgII-DOM, blue bars). To test how POM and DOM added with the HgII-POM, β-HgS(s)nano, and HgII-DOM tracers affected HgII methylation rates when not complexed to the HgII substrate (by e.g. altering the activity of HgII methylating bacteria), control experiments were conducted. In these control experiments, the HgII(aq) tracer was added to the sediment slurries simultaneously with POM (squares), β-HgS(s)nano (circles) or DOM (triangles). For the controls, error bars show ±SD calculated from n=2. An * associated with any bar or symbol indicates the data < Limit of Detection (LOD) and this value is shown.
