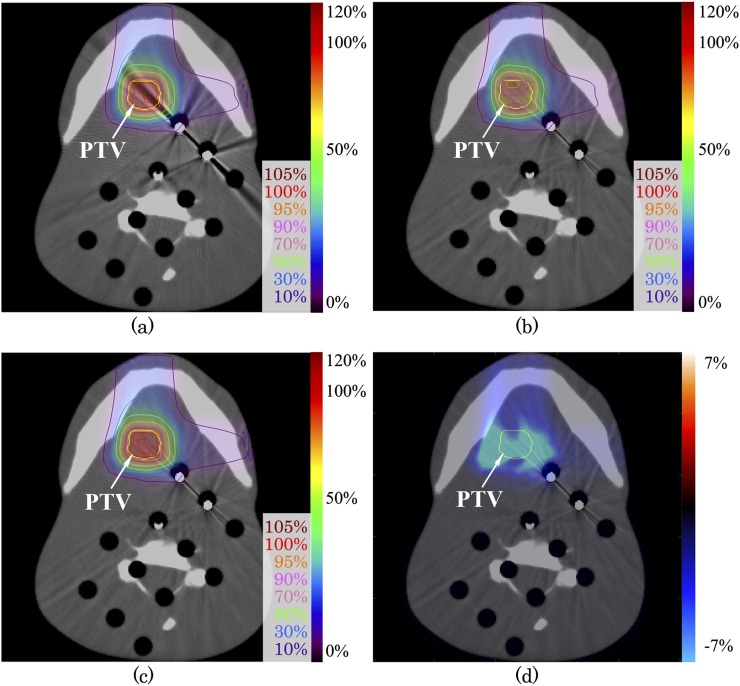
Figure 2.
Carbon-ion scanning dose distributions using head phantom images (a) without and (c) with single-energy metal artefact reduction (SEMAR). Beam spots and weights were optimized to an uncorrected image, and the dose distribution was calculated on SEMAR-corrected image (b). Dose distribution difference of (b) minus (c) is expressed by the colour scale on (d). The yellow line shows the planning target volume. For colour image see online.

