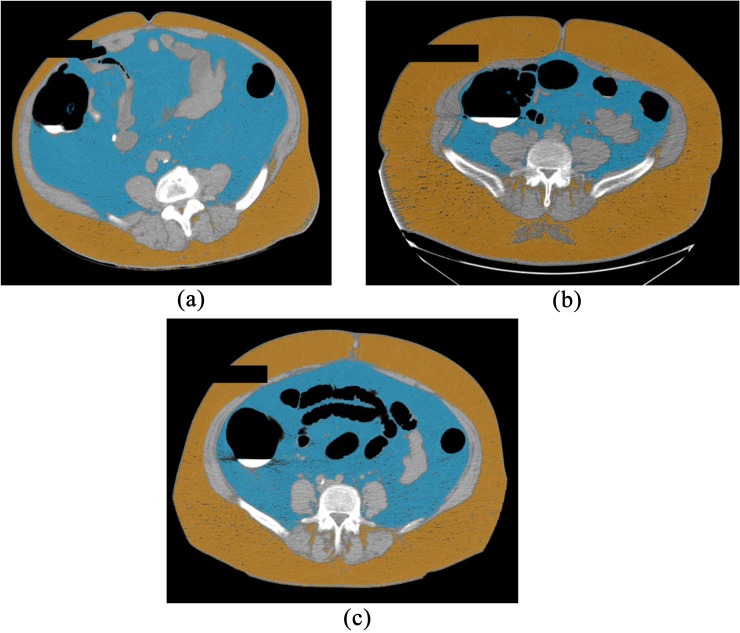
Figure 4.
Three examples of visceral vs subcutaneous fat localization and quantification at CT using a simple semi-automated software tool. The first patient (a) demonstrates high visceral fat content (blue) relative to subcutaneous fat (orange), compatible with an “apple-shaped” body habitus. The second patient (b) demonstrates the “pear-shaped” body habitus, with relative increase in subcutaneous fat over visceral fat. The third patient (c) demonstrates a more balanced state of obesity, with large amounts of both visceral and subcutaneous fat. These same measures can be obtained with MR (not shown). For colour image see online.

