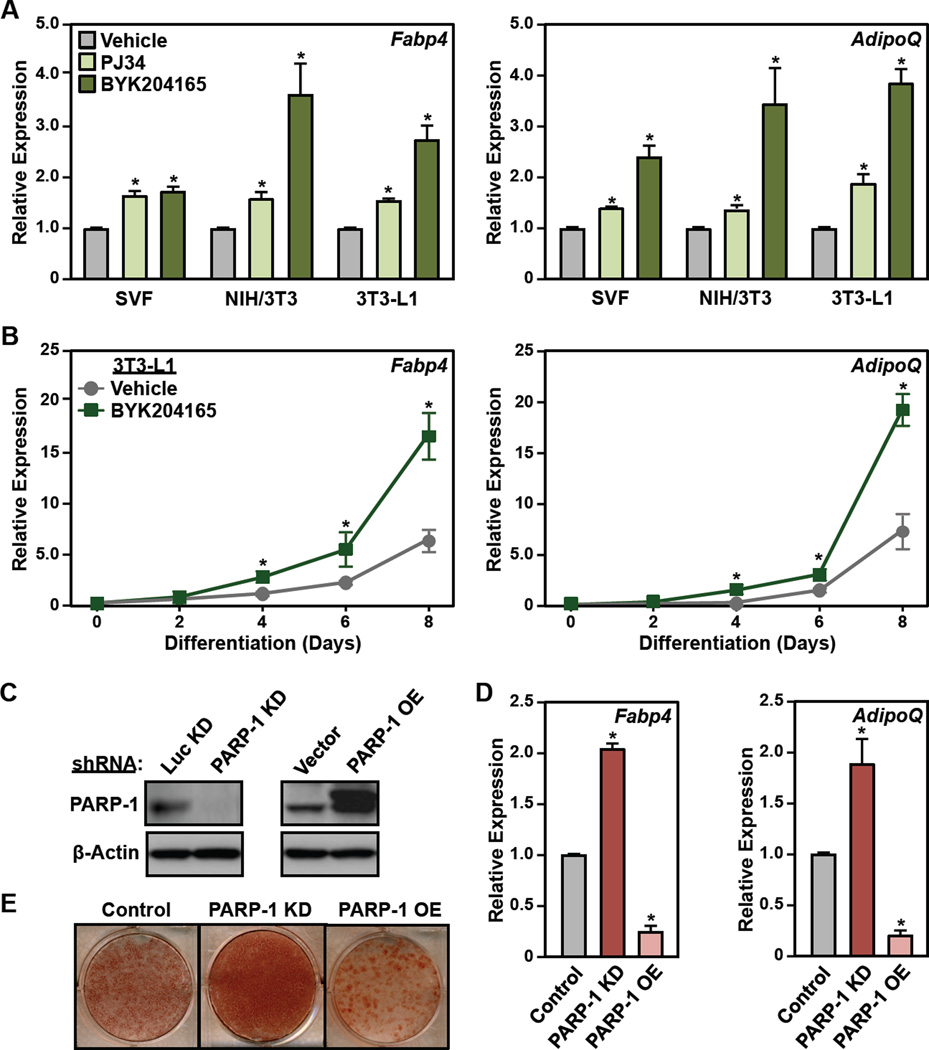
Figure 2. Inhibition or depletion of PARP-1 promotes the differentiation of preadipocytes.
(A) SVF, NIH/3T3, and 3T3-L1 cells were treated with 5 µM PJ34 or 20 µM BYK204165 prior to differentiation with MDI. Four days later, the relative expression of adipocyte marker genes Fabp4 and AdipoQ was assayed by RT-qPCR. Each bar represents the mean + SEM for three replicates. Bars marked with an asterisk are statistically different from the control (Student’s t-test; p-value < 0.05).
(B) Time course of differentiation in 3T3-L1 cells in response to MDI ± 20 µM BYK204165. The relative expression of adipocyte marker genes Fabp4 and AdipoQ was assayed by RT-qPCR every two days. Each point represents the mean ± SEM for three replicates. Points marked with an asterisk are statistically different from the vehicle-treated control (Student’s t-test; p-value < 0.05).
(C) Western blots showing the levels of PARP-1 after knockdown (KD) (left, using shRNAs targeting PARP-1 or luciferase, Luc,) or ectopic expression (right, Flag-tagged PARP-1) in 3T3-L1 cells. β-actin was used as a loading control.
(D and E) 3T3-L1 cells, with or without stable knockdown or ectopic expression of PARP-1, as (C), were differentiated with MDI. (C) Oil Red-O staining at day 8. (D) RT-qPCR for adipocyte marker genes Fabp4 and AdipoQ at day 4. Each bar represents the mean + SEM for three replicates. Bars marked with an asterisk are statistically different from the control (Student’s t-test; p-value < 0.05).
[See also Fig. S2]

