Figure 1.

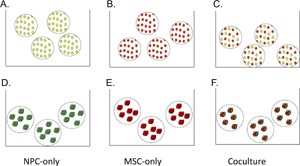
Individual cell (A–C) and micropellet (D–F) groups of NPCs (A and D), MSCs (B and E), and co‐cultured (C and F) cells allow us to compare the effects of cell type and cell configuration. NPCs are shown in green and MSCs are shown in red.

Individual cell (A–C) and micropellet (D–F) groups of NPCs (A and D), MSCs (B and E), and co‐cultured (C and F) cells allow us to compare the effects of cell type and cell configuration. NPCs are shown in green and MSCs are shown in red.