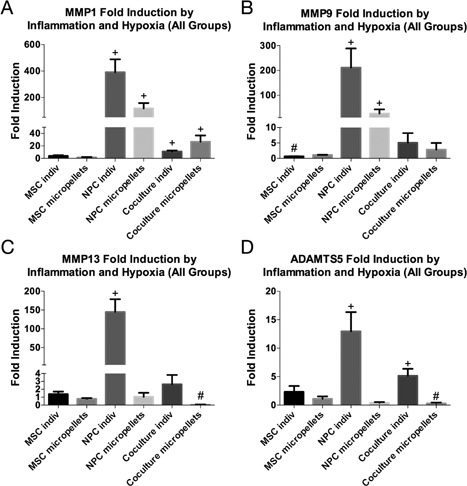
Figure 5.

Co‐culture and micropellet configurations exhibit reduced catabolic induction. Fold induction of catabolic markers MMP‐1 (A), MMP‐9 (B), MMP‐13 (C), and ADAMTS5 (D) represents the fold change between basal and hypoxic/inflammatory media conditions (normalized separately to the basal media condition for each group, which is not shown in the graph). The + and # symbols indicate a significant (p < 0.05) increase and decrease, respectively in expression in degenerative media conditions. Error bars represent standard deviation.
