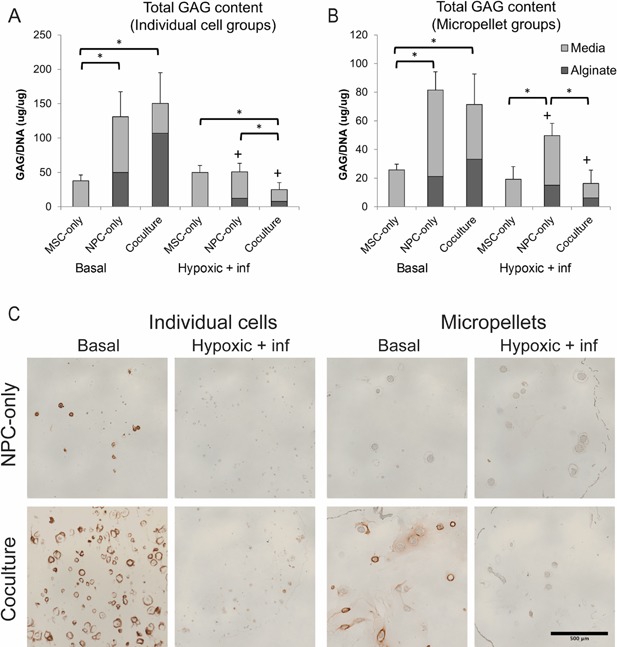
Figure 6.

Glycosaminoglycan content and distribution varies with cell type and configuration. We calculated total GAG content of individual cell (A) and micropellet (B) groups as the sum of GAG concentration (normalized by DNA content) in alginate bead and media samples. The + symbol indicates a significant difference (p < 0.05) within a cell type group for different media conditions, while the * symbol indicates a significant difference between different cell type groups under the same media conditions. Error bars represent standard deviation of the total GAG, and statistics were performed on the total as described in the methods section. Panel (C) shows distribution of aggrecan in NPC‐only and co‐culture individual cell, and micropellet constructs after 21 days in basal or inflammatory and hypoxic media conditions. Aggrecan staining (with a hematoxylin counterstain) was visible in co‐culture basal media groups as well as the NPC‐only individual cell baal media group, and was most concentrated in regions surrounding cells and micropellets. Scale bar: 500 μm.
