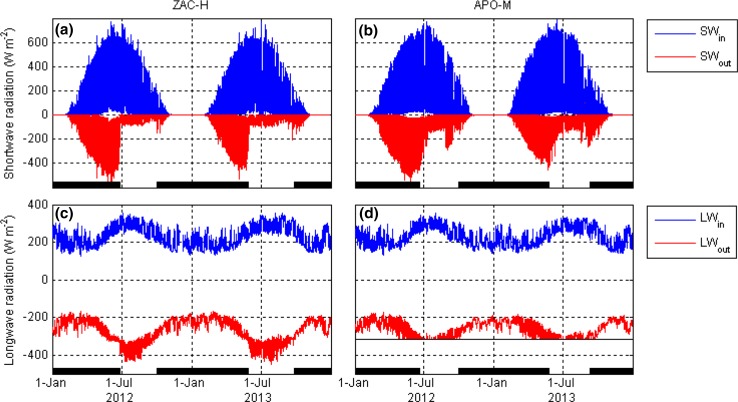
Fig. 2.
Incoming (SWin) and outgoing (SWout) shortwave radiation (a, b) and incoming (LWin) and outgoing (LWout) radiation (c, d) at Zackenberg dry heath tundra (ZAC-H; a, c) and A.P. Olsen glacier (APO-M; b, d) during 2012–2013. Thick black lines in the bottom of the panels indicate periods with continuous snow cover. Thin black line in d indicates outgoing longwave radiation at the melting point of ice (−316 W m−2)

