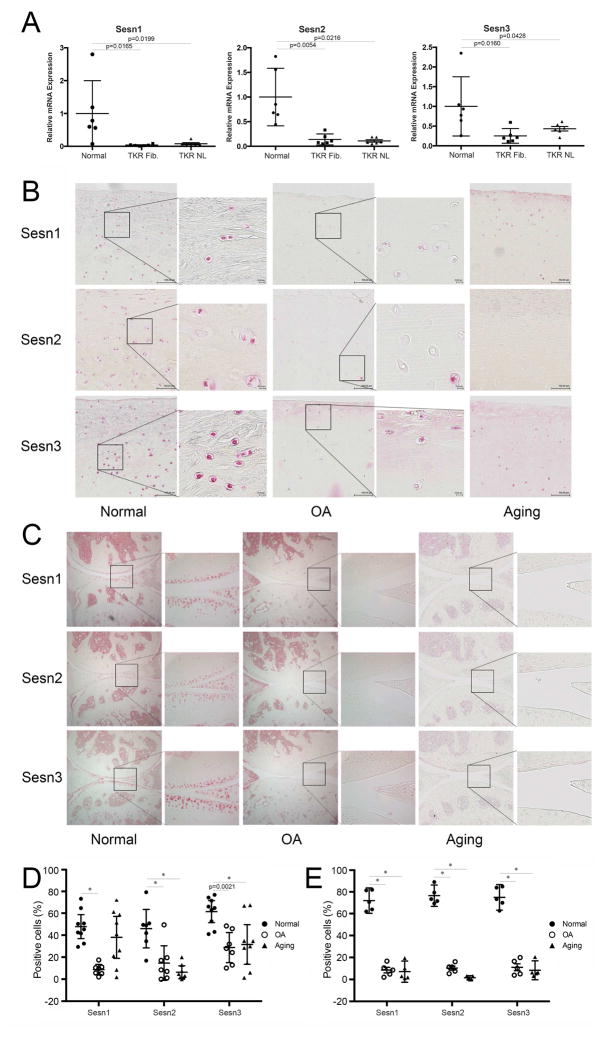
Figure 1. Sesn mRNA and protein expression in articular cartilage.
A) Sesn1, Sesn 2, and Sesn 3 mRNA levels were analyzed by quantitative PCR in cartilage samples from normal (N=6) and OA (N=6) donors. TKR Fib: total knee replacement, fibrillated area. TKR NL: total knee replacement, normal appearing area. Data are expressed as mean ± 95% confidence interval (CI). Data were analyzed by paired-samples t-test. * = P < 0.05 versus normal group.
B) Immunohistochemical analysis of Sesn expression in human cartilage collected from normal (N=9), aging (N=9) and OA (N=7) knee joints. Representative images are shown. Images are 10× and insets on the right are 40× magnification.
C) Immunohistochemical analysis of Sesn protein expression in mouse joints from normal (6 months old, N=5), aging (18 months old, N=5) and DMM induced OA (N=5). Representative images are shown. Images are 10×and insets are 40× magnification.
D) Quantification of Sesn1, Sesn2 and Sesn3 immunopositive cells in human cartilage superficial and mid zones. Data are expressed as % positive cells. Dara were analyzed by chi-square test. * = P < 0.05 versus normal group.
E) Quantification of Sesn1, Sesn2 and Sesn3 immunopositive cells in mouse articular cartilage. Data are expressed as % positive cells. Data were analyzed by chi-square test. * = P < 0.05 versus normal group.

