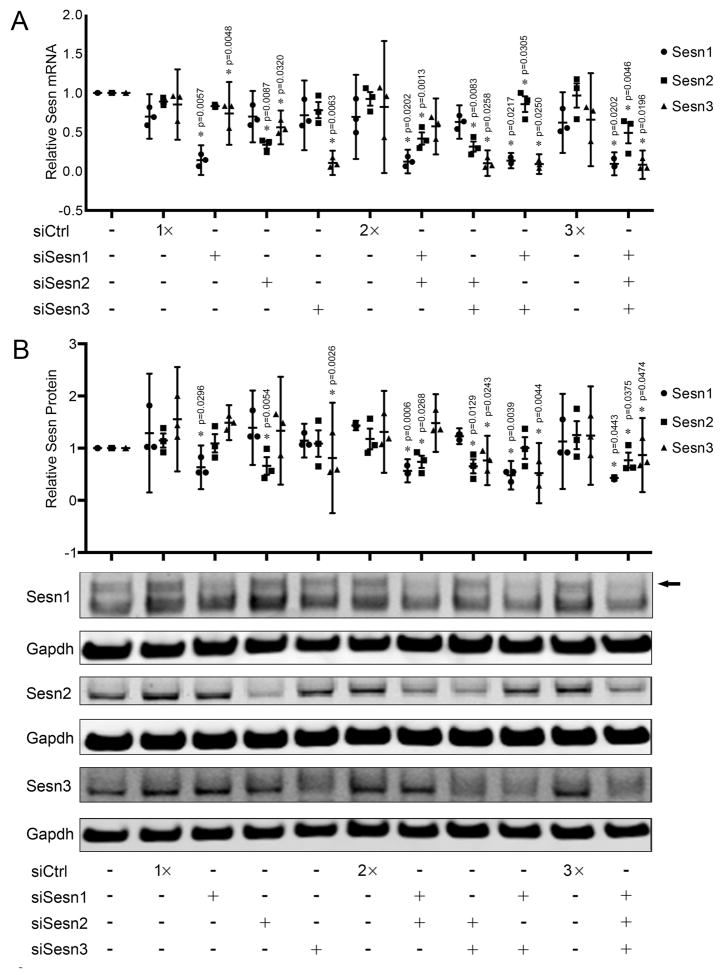
Figure 3. Specificity of Sesn siRNAs.
A) Sesn1, Sesn2 and Sesn3 mRNA levels analyzed by quantitative PCR in human articular chondrocytes transfected with small interfering RNA (siRNA) targeting Sesn (siSesn). Data are expressed as mean ±95% CI. Data were analyzed by paired-samples t-test. * = P < 0.05 versus siCtrl. Graphs represent quantitative PCR data from three different experiments using cells from different donors, each performed in duplicate.
B) Sesn1, Sesn2 and Sesn3 protein expression in human chondrocytes transfected with siSesn. Representative western blot images are shown. Graphs represent quantification of three different experiments. Data are expressed as mean ±95% CI. Data were analyzed by paired-samples t-test. * = P < 0.05 versus siSesnCtrl. Graphs represent quantification of western blots from three different experiments using cells from different donors, each performed in duplicate. Arrow marks Sesn1 specific band.

