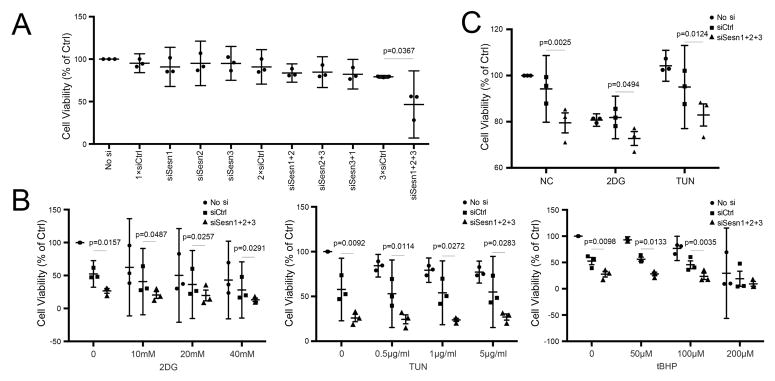
Figure 4. Sesn and chondrocyte viability.
A) Cell viability in cultured human chondrocytes transfected with individual and combinations siSesn assessed by MTT assay. Data are expressed as mean ±95% CI. Data were analyzed by paired-samples t-test. * = P < 0.05 versus siCtrl. Graphs represent quantification of MTT assay from three different experiments using cells from different donors, each performed in triplicate.
B) Cell viability in cultured human chondrocytes transfected with siRNA under treatment with different concentrations of 2-DG, TUN and tBHP. Viability was assessed using MTT assay. Data are expressed as mean ±95% CI. Data were analyzed by paired-samples t-test. * = P < 0.05 versus siCtrl. Graphs represent quantification by MTT assay from three different experiments using cells from different donors, each performed in triplicate.
C) Cell viability in cultured human chondrocytes transfected with combinations of siSesn under treatment with 2-DG (20mM), TUN (1ug/ml) and tBHP (250 uM) assessed by Celltiter-Glo assay. Data are expressed as mean ±95% CI. Data were analyzed by paired-samples t-test. * = P < 0.05 versus siCtrl. Graphs represent quantification of MTT assay from three different experiments using cells from different donors, each performed in triplicate.

