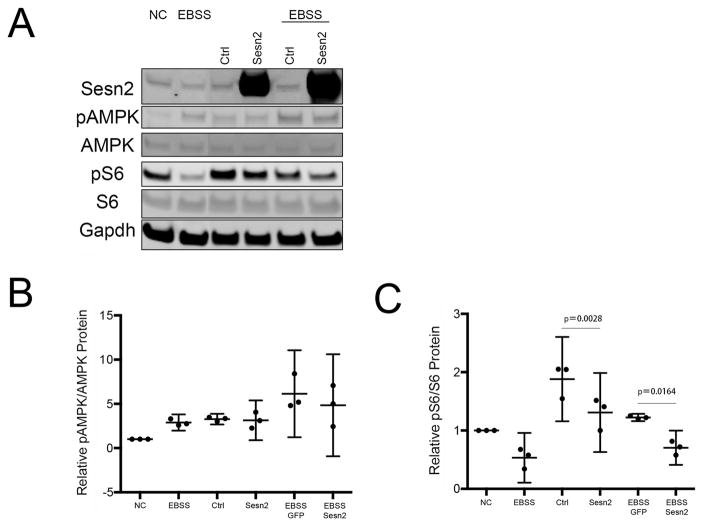
Figure 5. Sesn effects on mTOR and AMPK signaling pathway in human chondrocytes.
A) T-C/28 chondrocytes were transfected with indicated constructs for indicated time with or without EBSS and cell lysates were analyzed by western blotting. Representative western blot images are shown.
B) Graphs represent quantification of relative pAMPK/AMPK protein levels by western blots from three different experiments. Data are expressed as mean ±95% CI. Data were analyzed by paired-samples t-test.* = P < 0.05.
C) Graphs represent quantification of relative pS6/S6 protein levels by western blots from three different experiments. Data are expressed as mean ±95% CI. Data were analyzed paired-samples t-test. * = P < 0.05.

