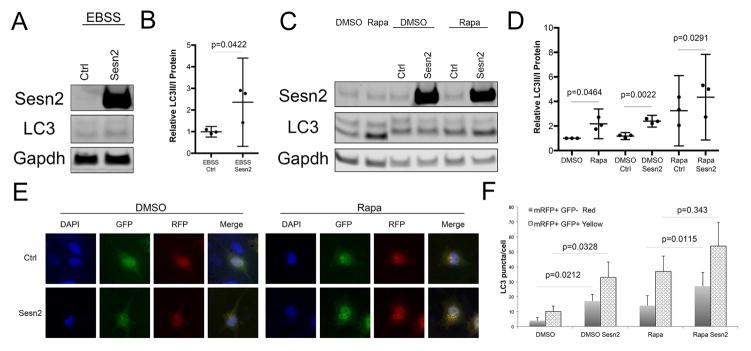
Figure 6. Sesn effects on autophagy in human chondrocytes.
A,B) T-C/28 cells transfected with the indicated constructs were treated with EBSS for 1 hour. Western blotting was performed with indicated antibodies. Representative western blot images are shown. Graphs represent quantification of western blots from three different experiments. Data are expressed as mean ± 95% CI. Data were analyzed by paired-samples t-test. * = P < 0.05.
C,D) T-C/28 cells transfected with the indicated constructs were treated with rapamycin (10uM, 6 hours). Western blotting was performed with indicated antibodies. Representative western blot images are shown. Graphs represent quantification of western blots from three different experiments. Data are expressed as mean ± 95% CI. Data were analyzed by paired-samples t-test. * = P < 0.05.
E,F) Autophagosome and autolysosome formation in T-C/28 cells following Sesn2 overexpression. The mRFP-GFP-LC3 plasmid was transfected into T-C/28 cells and 24 hours later cells were transfected with, Sesn2 plasmid. After 24 hours, the cells were treated with rapamycin (10uM, 6 hours). Representative images are shown. Graphs represent quantification of puncta in at least 20 cells from two different experiments. Data are expressed as mean ±95% CI. Data were analyzed by paired-samples t-test. * = P < 0.05.

