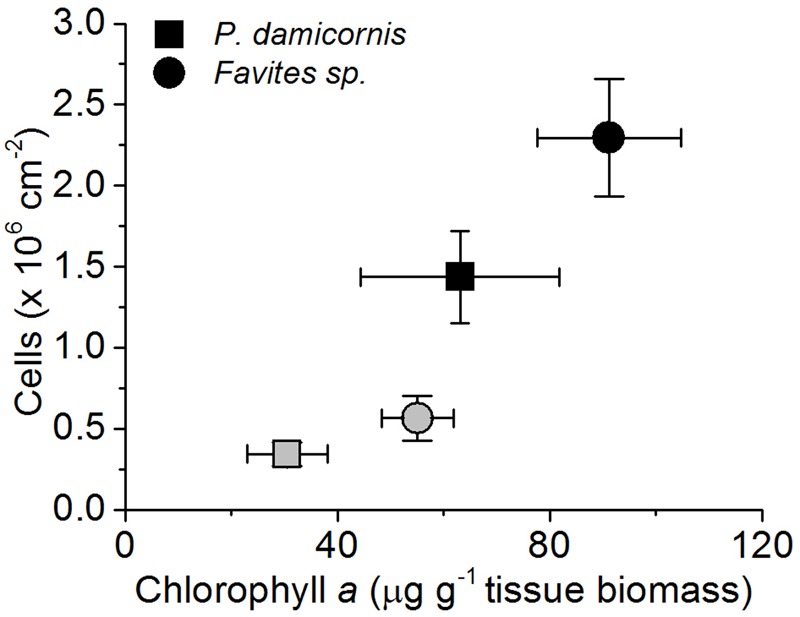
FIGURE 1.

Changes in Symbiodinium cell density (cells per cm-2 surface area) and chlorophyll a density (in μg chlorohyll a per g dry host tissue biomass) during the bleaching experiment. Healthy corals (black symbols) and bleached corals (gray symboles) were measured at the beginning (day 1) and the end of the experiment (day 10). Data are mean ± SEM; n = 4–8 for cell density estimates and n = 6–9 for chlorophyll a estimates.
