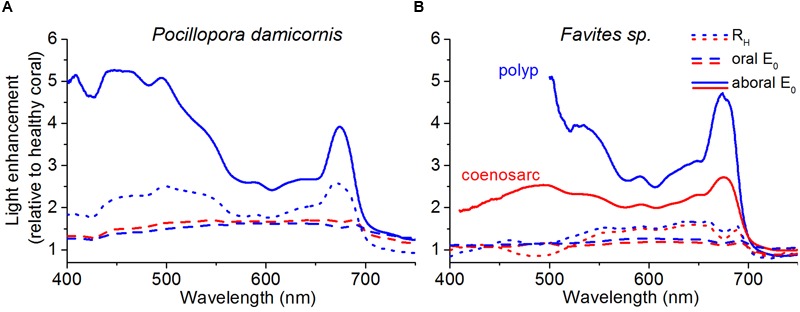
FIGURE 4.

Spectral light enhancement in bleached relative to healthy corals. The enhancement in E0(λ) and RH(λ) due to bleaching was calculated as E0(λ)bleached/E0(λ)healthy and RH(λ)bleached/RH(λ)healthy. RH(λ) (dotted lines) was measured at a distance of 1 cm from the tissue surface and E0(λ) was measured at the tissue surface (dashed lines) and in the aboral tissue layers closest to the skeleton (solid lines). Data was collected for both polyp (blue) and coenosarc tissues (red) for P. damicornis (A), and Favites sp. (B). Note that P. damicornis RH(λ) measurements include areas covering both polyp and coenosarc tissues, and that E0(λ) measurements were not performed in aboral coenosarc tissues of P. damicornis due to lack of sufficient tissue thickness. Original RH(λ) spectra for bleached and healthy corals are shown in Supplementary Figure S5.
