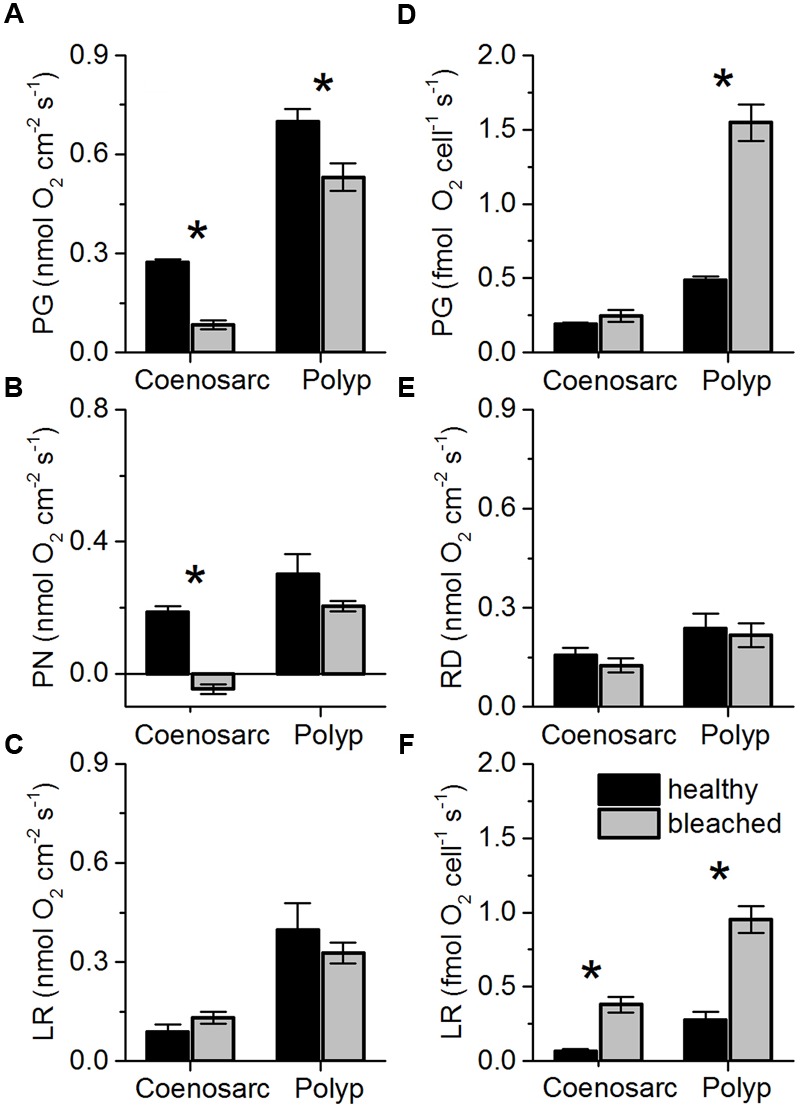
FIGURE 6.

Areal rates (in nmol O2 cm-2 s-1) of gross photosynthesis (A; PG), net photosynthesis (B; PN), and apparent light respiration (C; LR = PG-PN) and dark respiration (E; RD) in coenosarc and polyp tissues of healthy (black bars) and bleached fragments (gray bars) of Pocillopora damicornis. (D,F) same as left panels but normalized to cell density, i.e., cell specific-rates. Data are mean ± SEM (n = 10–12 corallite-level replicates). Significant differences (p < 0.05) between bleached and healthy tissues are marked with an asterisk.
