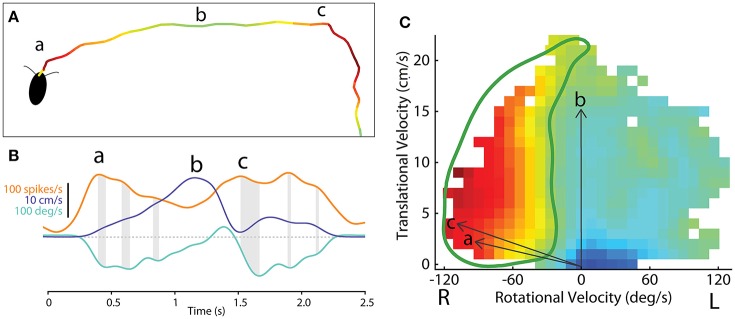
Figure 10.
Methodological concept for generating firing rate maps based on locomotor-related activity in the CX of freely-moving cockroach. (A) The path of a cockroach exploring the open arena. Color indicates firing rate of an example central-complex neuron during each segment of movement. (B) Smoothed firing rate of a central-complex neuron (orange), translational velocity (purple) and rotational velocity (cyan) of the animal during the bouts indicated at (a) and (b) and (c) in section A. Gray shading indicates the delay between peaks in the firing rate and peak rotational velocity of the resulting movement bout. (C) The firing rate for a single neuron is related to direction of movement in a manner similar to that used for tethered experiments (Figure 8). Here vectors of translational velocity vs. rotational velocity were created from video data (e.g., vectors a, b and c from time points indicated in B). At the tip of each vector a color coded box indicates the firing rate at that point in time. When this is done throughout a bout, a raw map of activity relative to motion is constructed. The firing rate map is then smoothed and gap-filled in 2 dimensions. Contour lines are then constructed from 0 to 100% of the maximum firing rate of this cell (not shown here). The 50% contour (thick, green line) is taken to represent the characteristic activity of the cell relative to movement direction. Adapted with permission from Martin et al. (2015).

