
Figure 11.
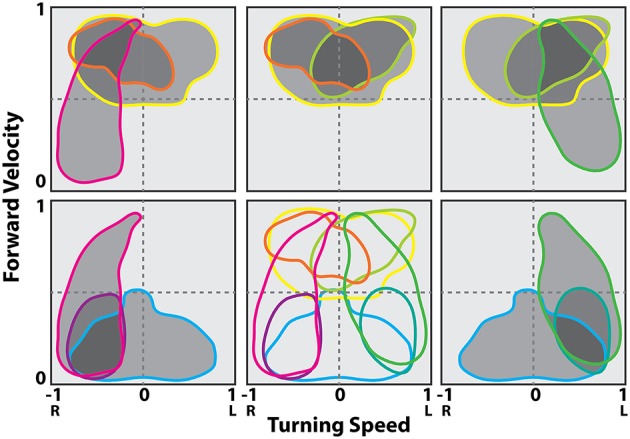
Contour lines in the translational and rotational velocity axes at the 50% of maximum firing rate levels from the firing rate map at the best delay (location of the peak in the stimulus kernel). Cells shown are a representative sampling of cells spanning the range of observed selectivity. Shading indicates groups of cells in a possible population selected for fast turns to the right (gray), fast turns to the left (yellow) and slow turns to the right (cyan). Modified with permission from Martin et al. (2015).