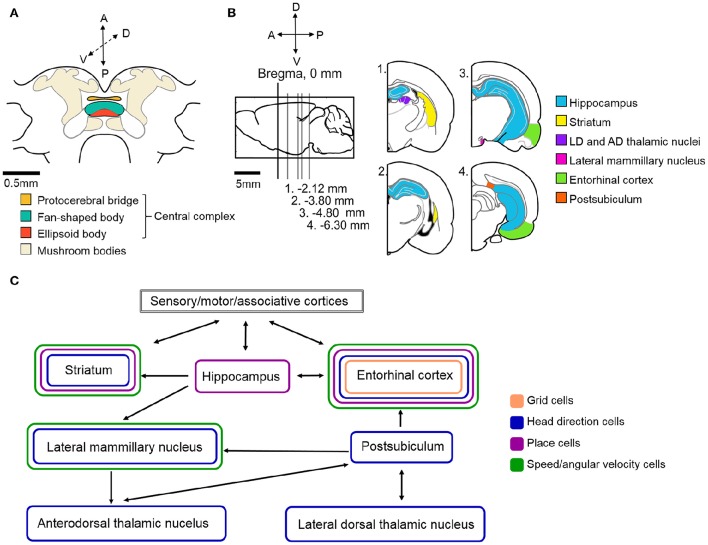
Figure 4.
Schematic illustration of the neural circuitry underlying cockroach and rat navigation and context discrimination. (A) Schematic illustration of the cockroach central brain with the potential navigation centers color coded (based upon Mizunami et al., 1998). (B) Schematic of a rat brain. Sagittal section where Bregma represents 0 mm (marked by black vertical line). Gray lines indicate the location of sections illustrated in the right side of the panel relative to Bregma. Navigation centers are color coded (all rat brain diagrams were created based upon Paxinos and Watson, 1996) (C) Arrows indicate the direction of communication between navigation centers in the rat brain. Brain regions are color coded based on the types of spatial cells that can be found in those locations. The exact roles of the above illustrated structures and the connections within the navigation circuit are described in more detail in the text. Based upon (Taube, 2007; Whitlock et al., 2008; Mizumori et al., 2009; Jankowski et al., 2013).

