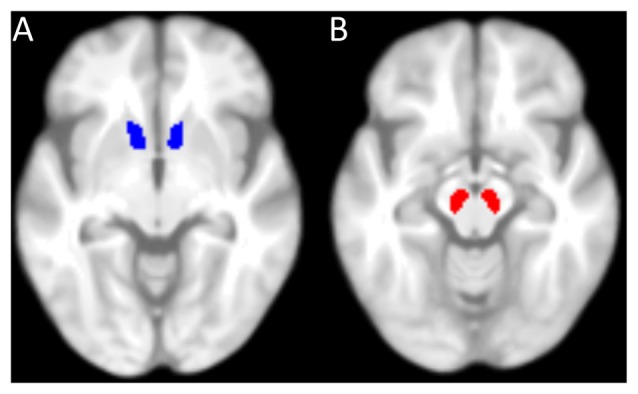
Figure 2.

Masks used for the region of interest analysis. (A) 50%-probability mask of the nucleus accumbens (NAcc) from the Harvard-Oxford-Atlas (implemented in FMRIB Software Library, FSL). (B) Mask of the substantia nigra (SN)/ventral tegmental area (VTA), manually drawn. Both masks are superimposed on the mean T1-weighted image of all elderly participants.
