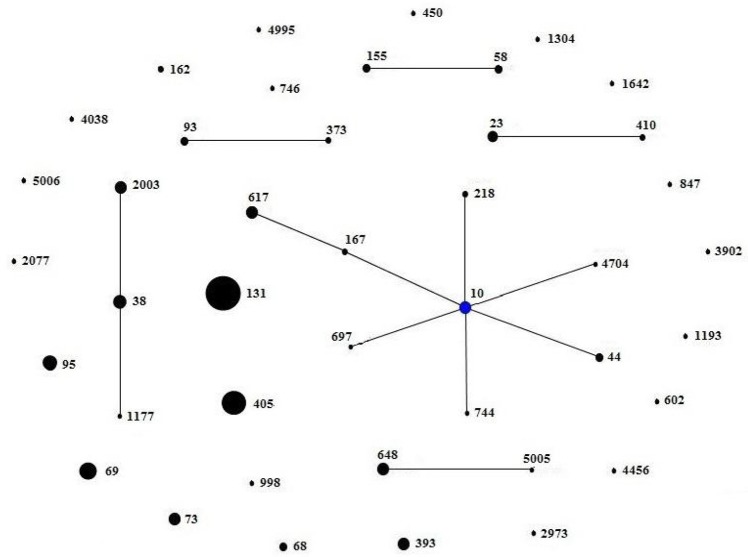
Figure 2.
Minimum spanning tree constructed based on the MLST profiles of ESBL-producing E. coli. There were 23 singletons, 5 groups (group1: ST58, ST155; group2: ST93, ST373; group3: ST23, ST410; group4: ST2003, ST38, ST1177; group5: ST648, ST5005), and 1 clonal complex (ST617, ST167, ST10, ST44, ST218, ST744, ST697, ST4704), which was radial. The blue dot in it indicated putative founder. The area of each black circle corresponded to the prevalence of the ST in the MLST data of this study.

