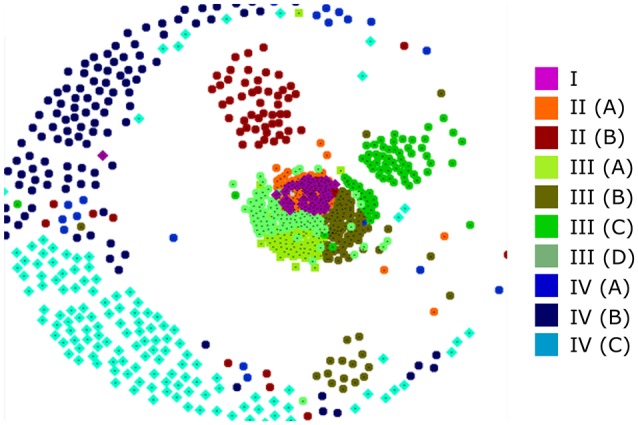
Figure 3.

A CLANS analysis of RALF protein similarity. Each of the 795 full-length protein sequences is represented by a colored dot that relates to the placement of that protein within the phylogenetic tree clades and subclades. Proteins that are closer within the 2D space are considered to have more sequence similarity.
